



Bitcoin and Gold Outlook: BTC surges past $85K as Gold slips
- Bitcoin extends its rally above $85,000 for the first time in eight months as bulls push for more control.
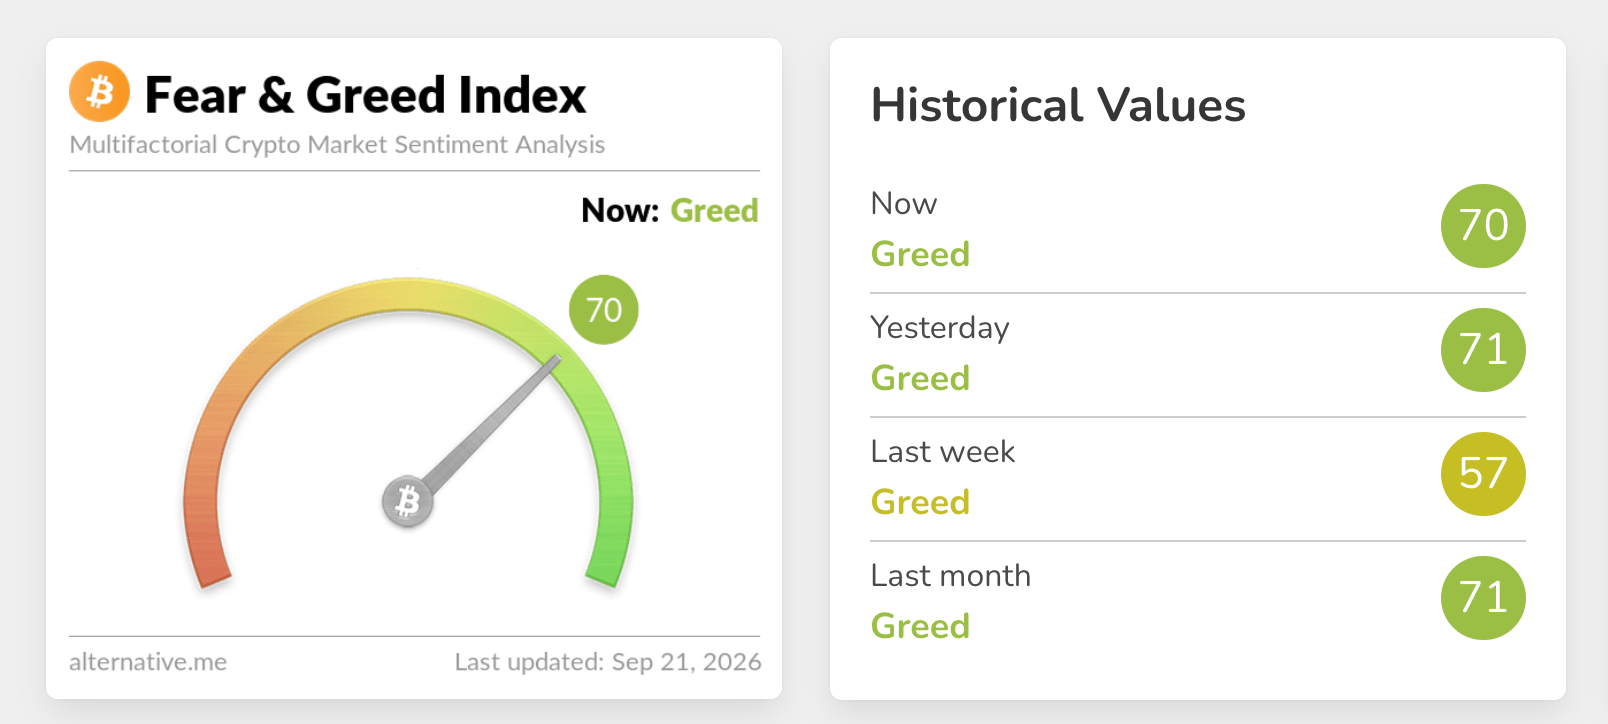
- Interest in crypto assets remains elevated, with the Fear & Greed Index holding at 70.
- Gold slides and trades around $4,340 as the 200-day EMA provides immediate support.
Bitcoin (BTC) rises alongside the broader cryptocurrency market on Monday, trading near $86,000 at the time of writing. The Crypto King has maintained a robust bullish outlook since September 16 and is currently targeting a short-term breakout to the resistance range between $88,000 and $90,000.
Meanwhile, Gold (XAU/USD) remains under pressure as it posts a minor correction. The metal hovers around $4,340 with short- and medium-term moving averages capping the upside. On the downside, Gold sits on top of structural support, which, if held, could attract fresh dip buying ahead of a potential recovery.
Market sentiment improves as Bitcoin rallies
Interest in crypto assets has continued to improve against the backdrop of elevated inflation in the United States (US), which prompted the Federal Reserve (Fed) to raise rates by 25 basis points last Wednesday. This tighter monetary policy is part of the central bank’s goal of bringing inflation down to 2% amid pressure from geopolitical tensions in the Middle East.
However, the crypto Fear & Greed Index has remained relatively elevated over the last few weeks, suggesting buyers are returning in anticipation of continued price increases. The index stands at 70 in the Greed territory, rising from 57 last week. If sustained, the higher interest would continue to create a tailwind and propel Bitcoin to higher levels.
Technical analysis: Bitcoin rally gains momentum
Bitcoin trades near $86,000, maintaining a firm bullish bias as price holds well above the 50-day, 100-day, and 200-day Exponential Moving Averages (EMAs) clustered between roughly $72,300 and $75,000, with the latest SuperTrend support near $75,974.
The Relative Strength Index (RSI) at about 73 shows overbought conditions, while the Moving Average Convergence Divergence (MACD) has turned positive with the line above its signal and a growing positive histogram, which together suggest strong but potentially stretched upside momentum.
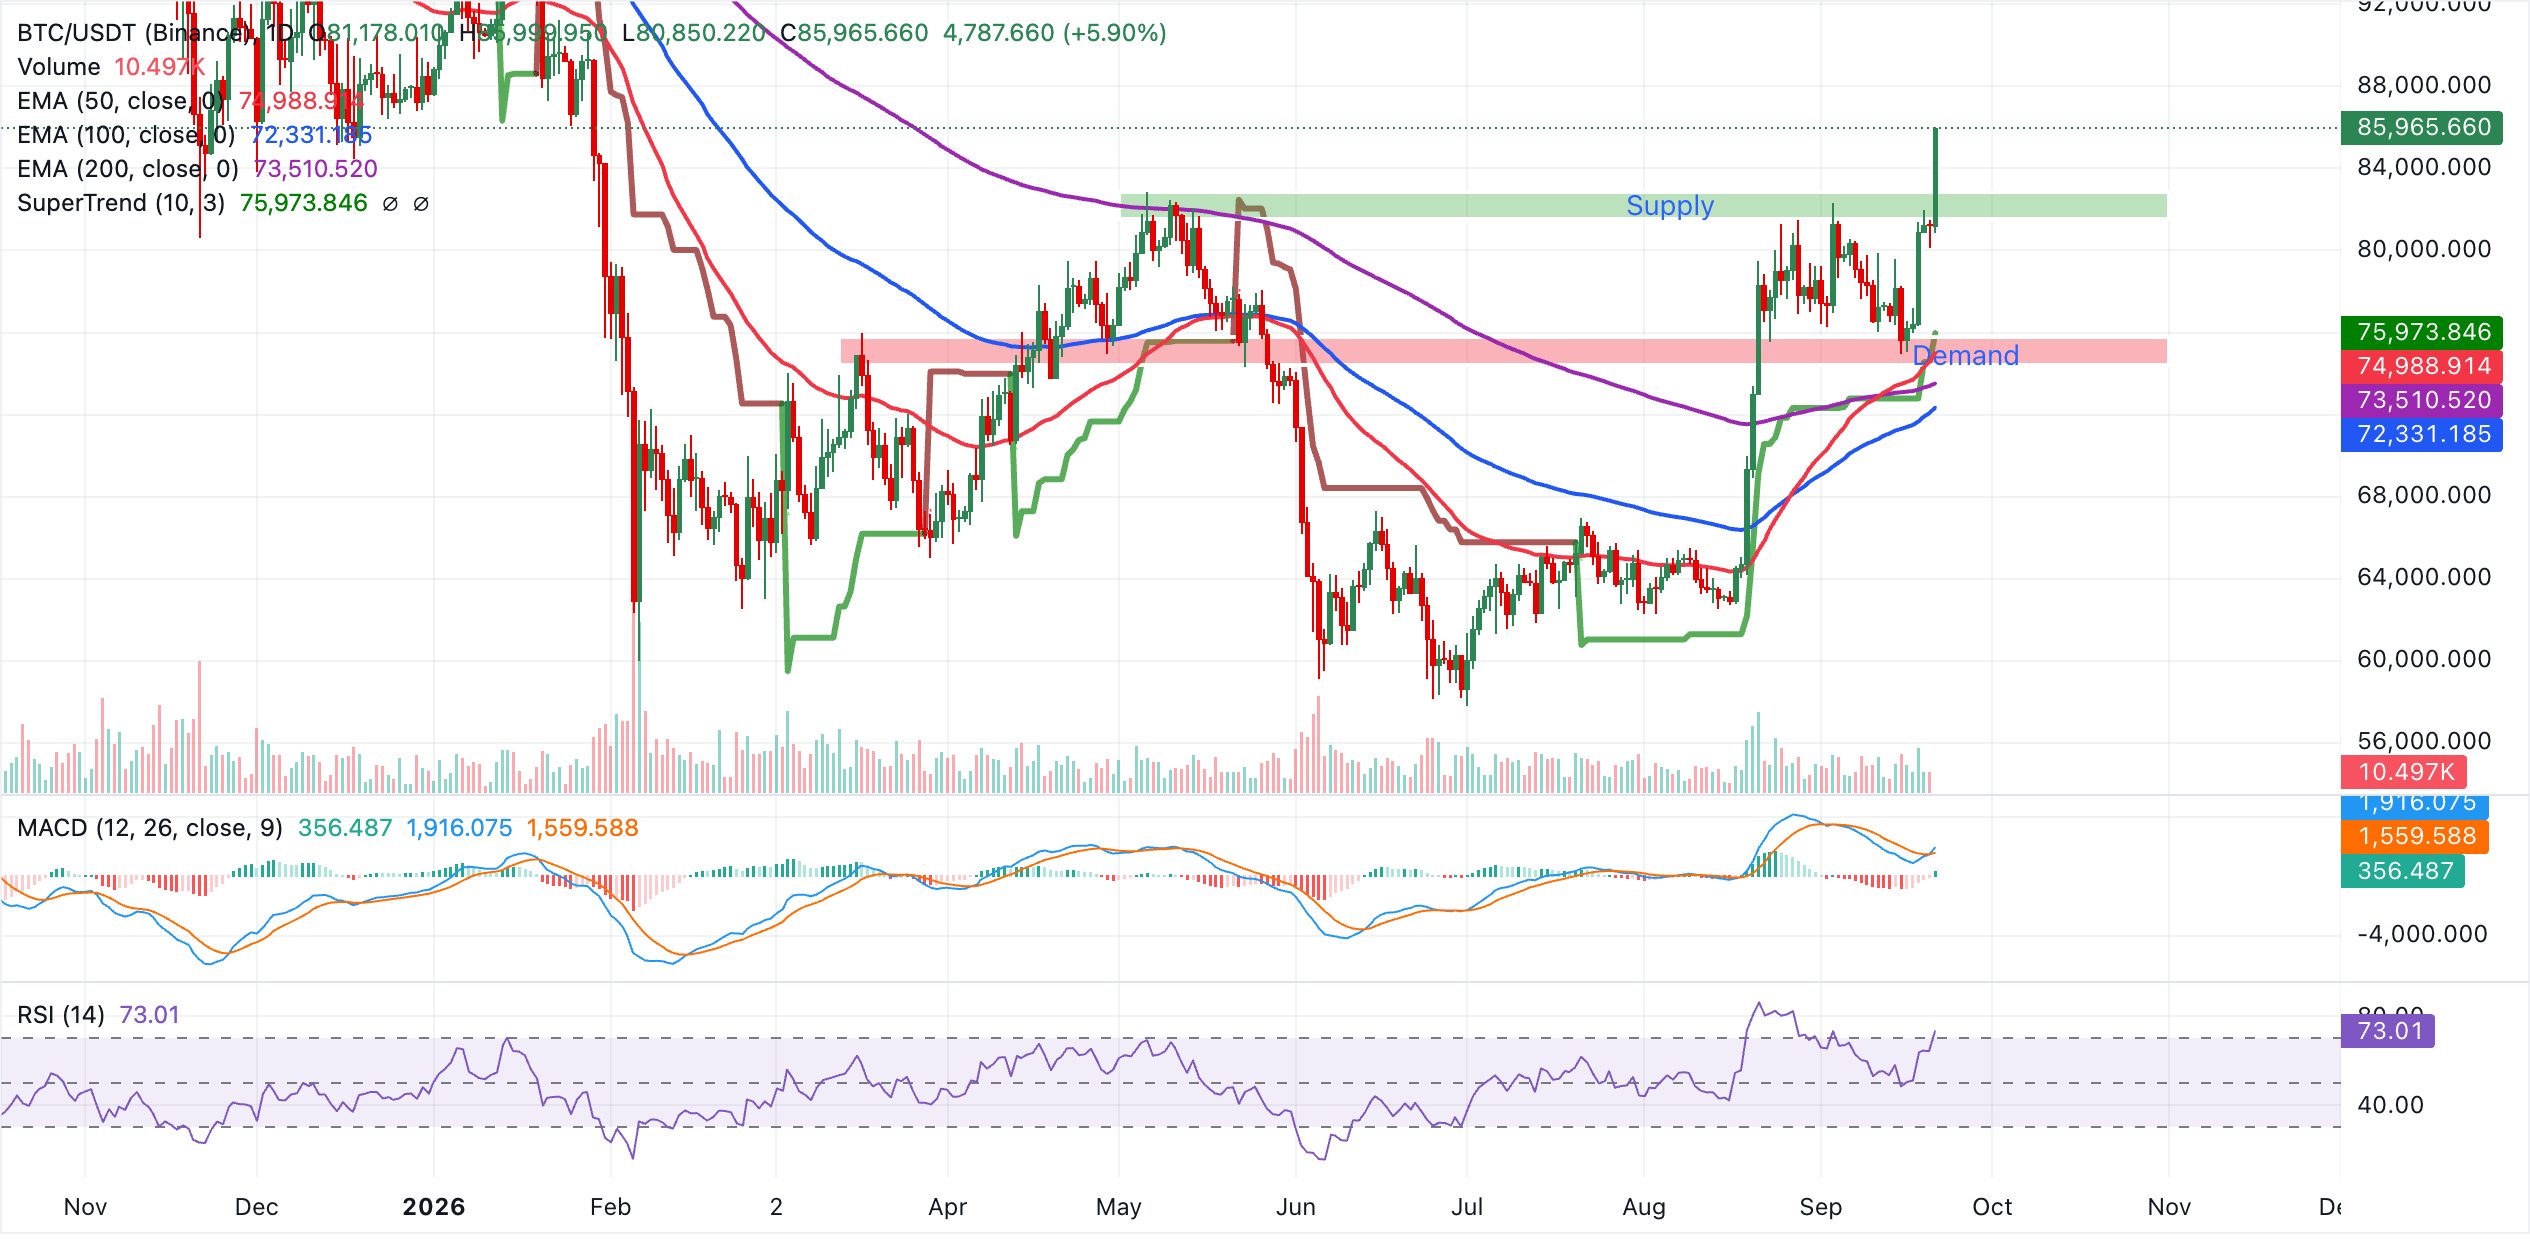
Initial support is at $84,000 and $80,000, key psychological levels, followed by the SuperTrend line around $75,974. This setup has been reinforced by the 50-day EMA near $74,989, with deeper demand at the 200-day EMA around $73,511 and the 100-day EMA near $72,331 if a sharper pullback unfolds.
As long as BTC holds above this stacked EMA band and the SuperTrend floor, the broader structure remains constructive, though overbought momentum warns that any spike to fresh highs could be followed by a volatility-driven correction back toward these underlying supports.
Gold technical analysis: Headwinds intensify as XAU/USD slides
In the daily chart, XAU/USD trades at $4,340, retaining a bearish near-term bias as it sits below the 50-day EMA at $4,344 and the 100-day EMA at $4,362. The 200-day EMA at $4,321 now offers underlying trend support just beneath spot, while the SuperTrend indicator at $4,591 and a descending resistance trendline projecting near $4,506 highlight a broader topside cap.
Momentum remains soft, with the RSI hovering around 48, while the MACD shows negative readings and a subdued histogram, suggesting recovery attempts could struggle below nearby moving-average barriers.
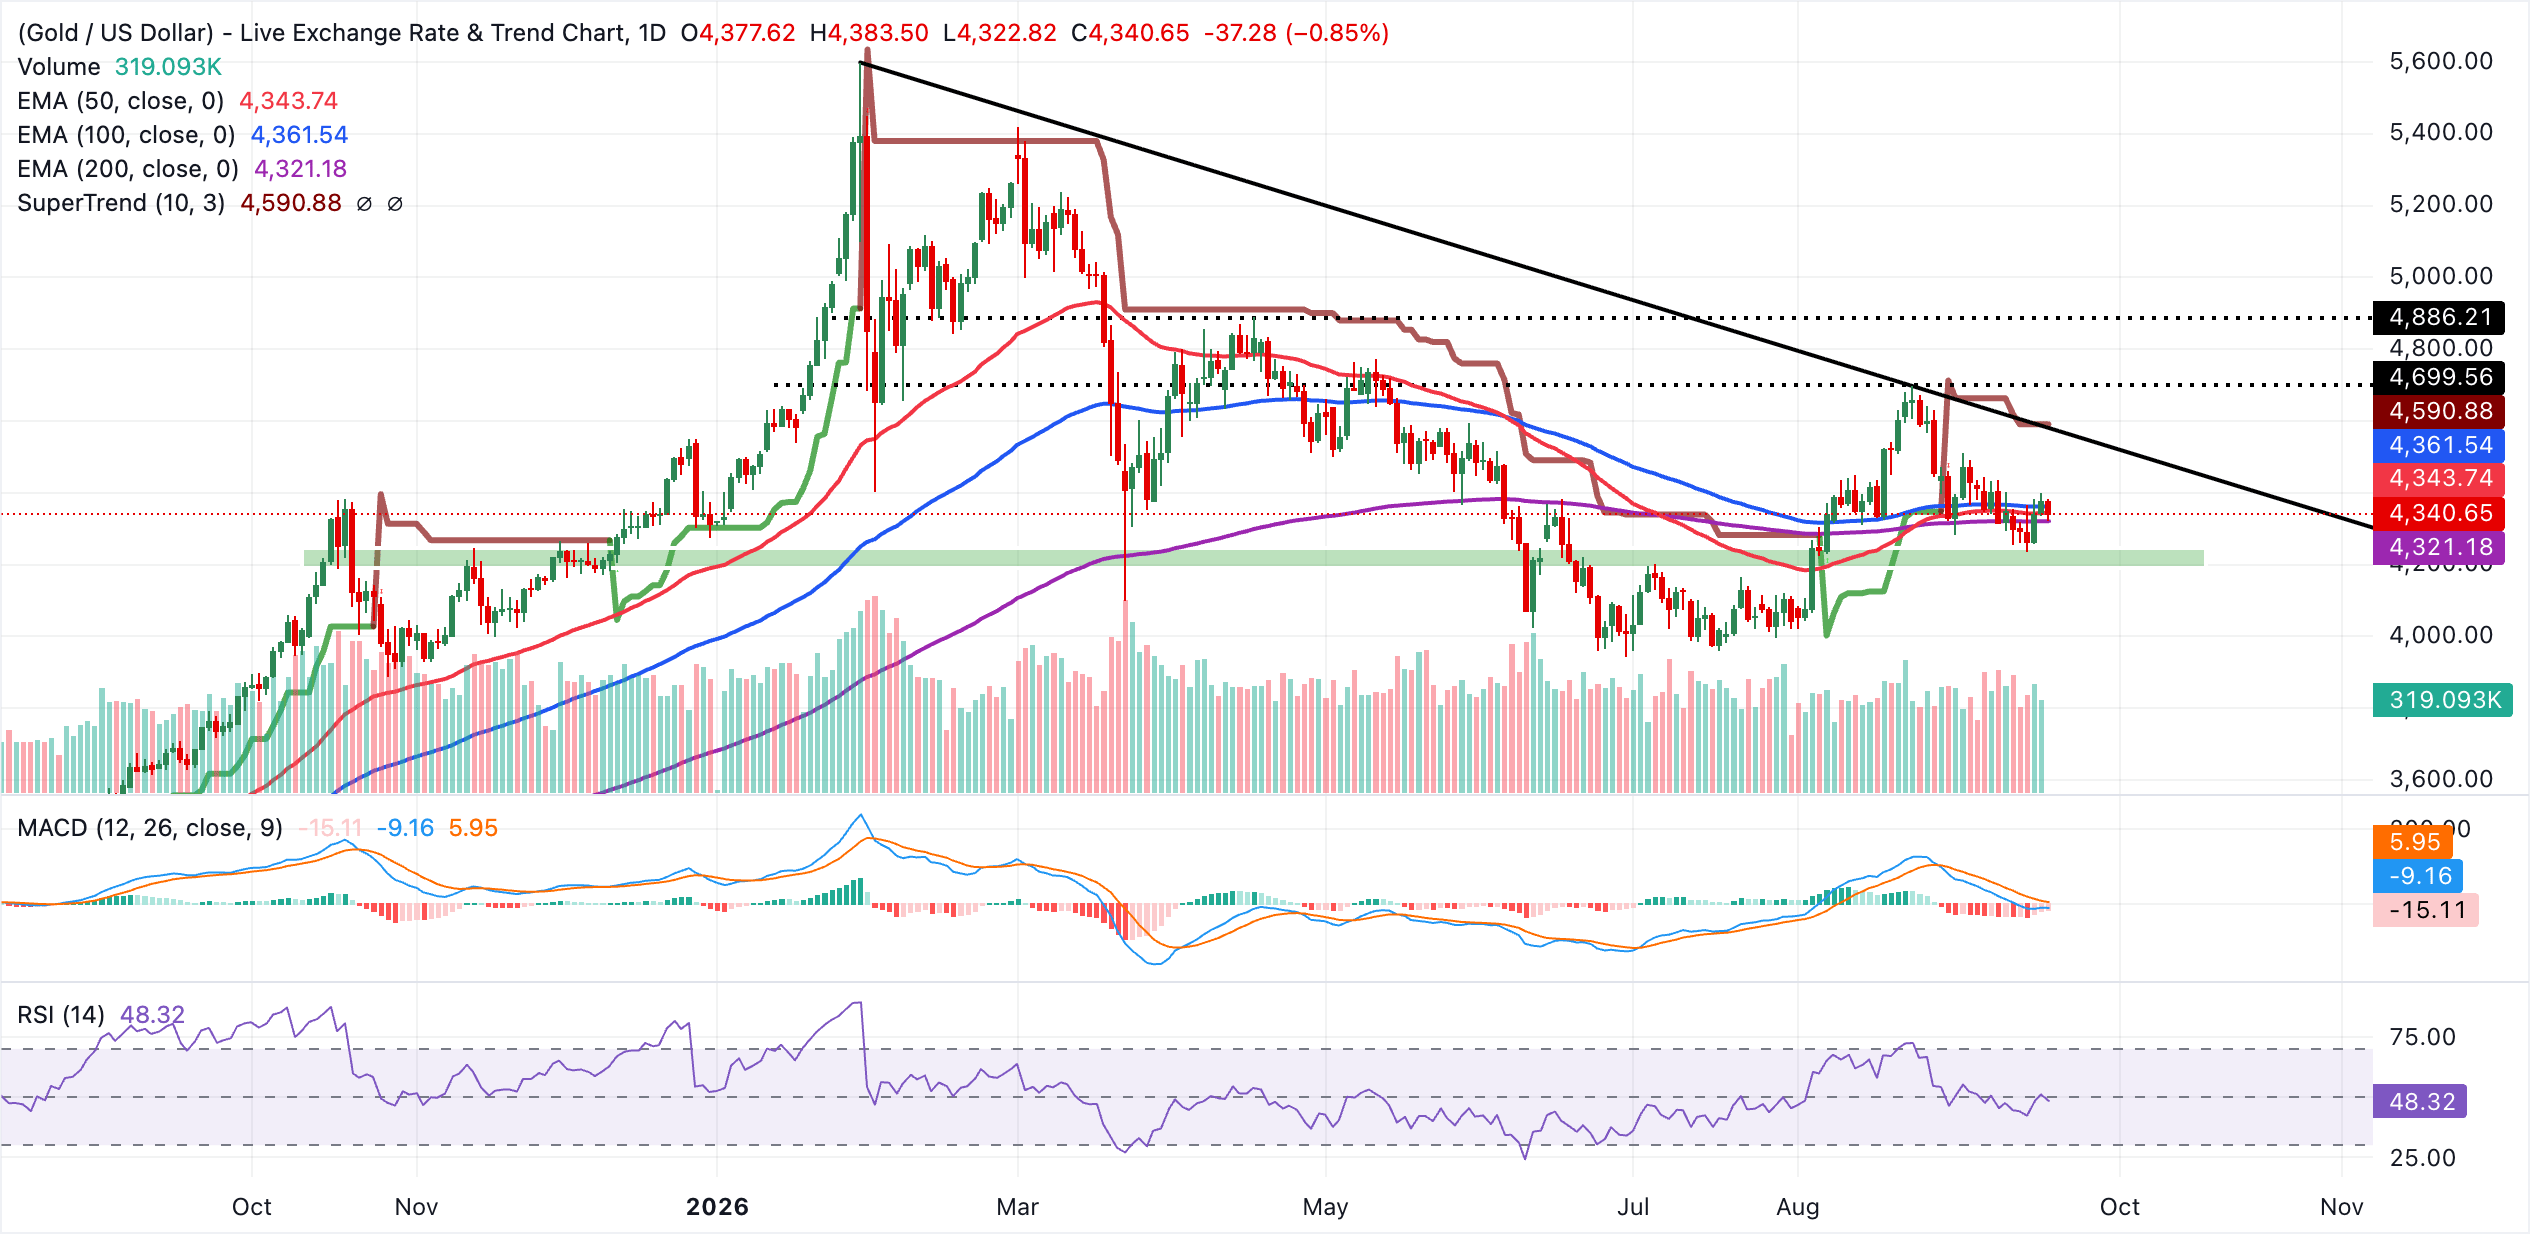
On the topside, immediate resistance is clustered around the short-term averages, starting with the 50-day EMA at $4,344, followed by the 100-day EMA at $4,362. A break above these would expose the descending trendline resistance near $4,506, ahead of the more distant SuperTrend level at $4,591. On the downside, initial support lies at the 200-day EMA at $4,321. A daily close below this floor would reinforce the bearish tone and open the way for a deeper pullback toward prior lows not visible in the current indicator set.
(The technical analysis of this story was written with the help of an AI tool. Know more.)
Bitcoin, altcoins, stablecoins FAQs
Bitcoin is the largest cryptocurrency by market capitalization, a virtual currency designed to serve as money. This form of payment cannot be controlled by any one person, group, or entity, which eliminates the need for third-party participation during financial transactions.
Altcoins are any cryptocurrency apart from Bitcoin, but some also regard Ethereum as a non-altcoin because it is from these two cryptocurrencies that forking happens. If this is true, then Litecoin is the first altcoin, forked from the Bitcoin protocol and, therefore, an “improved” version of it.
Stablecoins are cryptocurrencies designed to have a stable price, with their value backed by a reserve of the asset it represents. To achieve this, the value of any one stablecoin is pegged to a commodity or financial instrument, such as the US Dollar (USD), with its supply regulated by an algorithm or demand. The main goal of stablecoins is to provide an on/off-ramp for investors willing to trade and invest in cryptocurrencies. Stablecoins also allow investors to store value since cryptocurrencies, in general, are subject to volatility.
Bitcoin dominance is the ratio of Bitcoin's market capitalization to the total market capitalization of all cryptocurrencies combined. It provides a clear picture of Bitcoin’s interest among investors. A high BTC dominance typically happens before and during a bull run, in which investors resort to investing in relatively stable and high market capitalization cryptocurrency like Bitcoin. A drop in BTC dominance usually means that investors are moving their capital and/or profits to altcoins in a quest for higher returns, which usually triggers an explosion of altcoin rallies.
Nothing in this material constitutes investment advice, personal recommendation, investment research, an offer, or a solicitation to buy or sell any financial instrument. The content has been prepared without consideration of your individual investment objectives, financial situation, or needs, and should not be treated as such.
Past performance is not a reliable indicator of future performance and/or results. Forward-looking scenarios or forecasts are not a guarantee of future performance. Actual results may differ materially from those anticipated.
Mitrade makes no representation or warranty as to the accuracy or completeness of the information provided and accepts no liability for any loss arising from reliance on such information.
Recommended Articles


