



BP PLC Stock (BP) Moved Down by 3.06% on Sep 21: Facts Behind the Movement
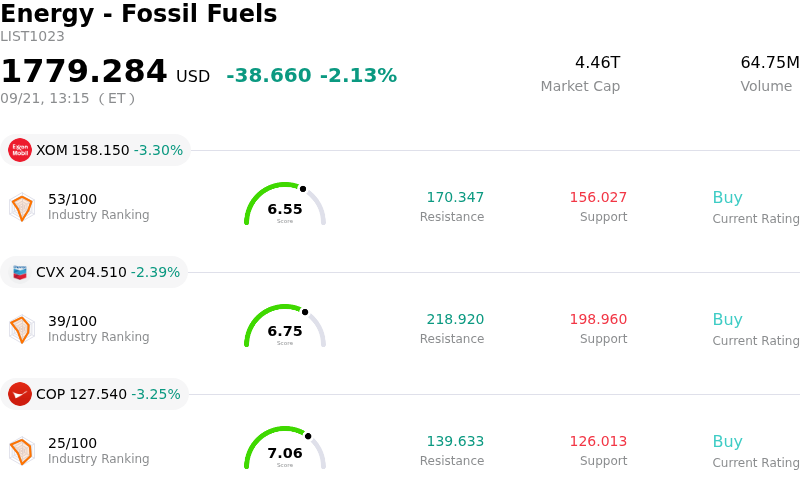
BP PLC (BP) moved down by 3.06%. The Energy - Fossil Fuels sector is down by 2.13%. The company underperformed the industry. Top 3 stocks by turnover in the sector: Exxon Mobil Corp (XOM) down 3.30%; Chevron Corp (CVX) down 2.39%; ConocoPhillips (COP) down 3.25%.
What is driving BP PLC (BP)’s stock price down today?
The downward pressure on BP's shares during the trading session is primarily driven by a broader retreat in global crude oil prices. Benchmark oil contracts experienced a decline as geopolitical tensions in the Middle East showed signs of easing, leading to increased shipping traffic through key maritime corridors and a reduction in geopolitical risk premiums across commodity markets. Because integrated oil and gas majors maintain high earnings sensitivity to crude price fluctuations, the pull-back in futures prices directly dampened near-term revenue expectations for upstream operations, triggering sector-wide profit-taking across energy equities.
On the corporate front, BP announced an agreement to divest a five-percent stake in the offshore Browse LNG project in Western Australia to Osaka Gas, continuing its strategy of portfolio optimization and disciplined capital management. While this transaction supports management's focus on debt reduction, balance sheet strength, and streamlining upstream assets, the announcement was largely overshadowed by the broader decline in oil prices. Investors evaluated the steady execution of long-term strategic divestments against immediate margin pressures resulting from lower benchmark energy prices.
From a strategy perspective, market sentiment reflected a rotation away from energy holdings as reduced commodity volatility prompted institutional portfolio adjustments. Despite BP maintaining solid fundamental indicators—including favorable valuation metrics and strong underlying operational cash flow—macroeconomic factors and energy commodity trends dominated daily trading activity. For market participants, short-term price discovery will remain closely linked to international crude stability, global refining crack spreads, and ongoing capital discipline execution.
Technical Analysis of BP PLC (BP)
Technically, BP PLC (BP) shows a MACD (12,26,9) value of -0.353, indicating a neutral signal. The RSI at 44.861 suggests neutral condition and the Williams %R at 92.674 suggests oversold condition. Please monitor closely.
Fundamental Analysis of BP PLC (BP)
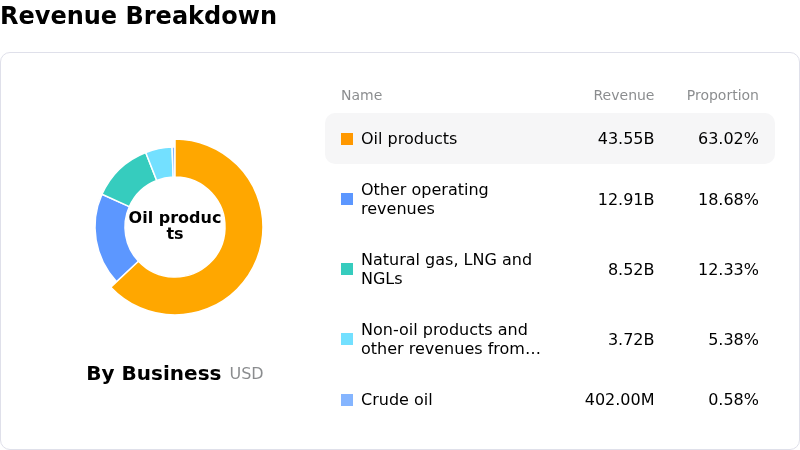
BP PLC (BP) is in the Energy - Fossil Fuels industry. Its latest annual revenue is $189.34B, ranking 3 in the industry. The net profit is $54.00M, ranking 63 in the industry. Company Profile
Over the past month, multiple analysts have rated the company as Buy, with an average price target of $49.09, a high of $64.00, and a low of $41.00.
More details about BP PLC (BP)
Company Specific Risks:
- Browse LNG Stake Sell-Down: BP's decision to trim its stake in Western Australia's Browse gas project down to 34.33% highlights persistent capital constraints, forcing management to farm out future upside in major natural gas assets to meet balance sheet targets.
- Balance Sheet Constraints and Debt Pressure: Substantial net debt levels have compelled BP to pursue an aggressive $20 billion divestment campaign through 2027, restricting excess cash flow allocation and limiting capital returns to shareholders relative to industry peers.
- Operational Reliability Lapses: Declines in global plant reliability to 92.4% reveal operational execution vulnerabilities, amplifying intraday volatility as short-term technical indicators remain tilted toward sell-side pressure.
- Executive Governance and Leadership Turnover: Frequent executive suite reshuffling—including the unexpected dismissal of former Chair Albert Manifold over governance and conduct issues—continues to fuel institutional skepticism regarding strategic execution and board stability.
Nothing in this material constitutes investment advice, personal recommendation, investment research, an offer, or a solicitation to buy or sell any financial instrument. The content has been prepared without consideration of your individual investment objectives, financial situation, or needs, and should not be treated as such.
Past performance is not a reliable indicator of future performance and/or results. Forward-looking scenarios or forecasts are not a guarantee of future performance. Actual results may differ materially from those anticipated.
Mitrade makes no representation or warranty as to the accuracy or completeness of the information provided and accepts no liability for any loss arising from reliance on such information.
Recommended Articles


