



NZD/USD (NZDUSD) Volatility Intensified on Oct 13: Factors to Watch
NZD/USD (NZDUSD) is up 0.50% at Oct 13 08:10(ET), now at $0.5613, with a 7-day down of 0.12%.
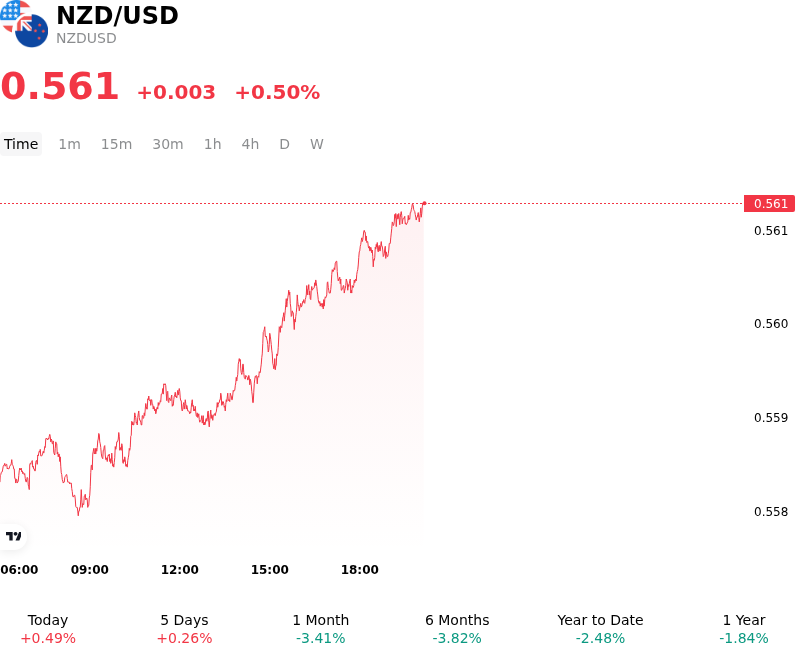
What is driving NZD/USD (NZDUSD)’s stock price up today?
The advance in NZDUSD was primarily driven by a broad-based pullback in the US dollar as US Treasury yields retreated from recent multi-month highs, prompting institutional traders to trim long dollar positions. A retreat in crude oil prices helped cool short-term inflation expectations, triggering a modest decline in US bond yields and reducing safe-haven demand for the greenback. In addition, cautious positioning ahead of crucial US consumer price index data led market participants to consolidate dollar gains, allowing risk-sensitive currencies to capture relief flows.
The New Zealand dollar also benefited from technical short-covering and selective dip-buying after trading near key multi-month support levels. Relative interest-rate expectations contributed to the pair's rebound, as markets reassessed the policy trajectory of the Reserve Bank of New Zealand against Federal Reserve rate expectations. A slight compression in the US-New Zealand yield differential favored the kiwi dollar, as domestic monetary policy expectations remained anchored by stubborn underlying inflation metrics.
While the session reflected a clear relief rally, the sustainability of the recovery remains uncertain. Global risk sentiment remains fragile due to ongoing geopolitical developments and energy price volatility, which could quickly restore demand for safe-haven assets. Investors continue to monitor incoming macroeconomic indicators and central bank commentary to assess whether the move marks the beginning of a sustained trend reversal or merely a tactical pause within a wider consolidation phase.
Technical Analysis of NZD/USD (NZDUSD)
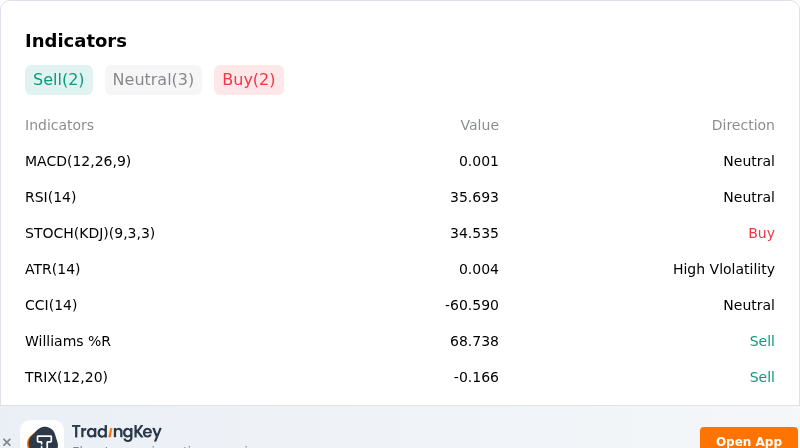
Technically, NZD/USD (NZDUSD) shows a MACD (12,26,9) value of 0.001, indicating a neutral signal. The RSI at 35.693 suggests neutral condition and the Williams %R at 68.738 suggests sell condition. Please monitor closely.
More details about NZD/USD (NZDUSD)
Recent Events and Risks:
- RBNZ Dovish Stance and Widening Yield Differentials: Subdued domestic economic growth expectations and a cautious policy stance from the Reserve Bank of New Zealand continue to widen yield spreads against the Federal Reserve, eroding carry trade support for the Kiwi dollar.
- U.S. Yield Resilience and Sustained Greenback Strength: Elevated U.S. Treasury yields driven by sticky U.S. inflation indicators and persistent hawkish Federal Reserve expectations continue to bolster broad-based U.S. Dollar demand, placing downside pressure on NZD/USD near key support levels.
- China Macro Headwinds and Commodity Export Exposure: Ongoing economic growth concerns and soft domestic demand in China—New Zealand's primary trade destination—weigh on agricultural commodity export sentiment and trigger risk-off capital outflows from the Kiwi.
- Fiscal Deficit Concerns and Risk-Averse Market Sentiment: Markets remain concerned over New Zealand's elevated government budget deficits and fiscal outlook, leaving the risk-sensitive NZD highly vulnerable to intraday sell-offs during periods of global equity market volatility.
Nothing in this material constitutes investment advice, personal recommendation, investment research, an offer, or a solicitation to buy or sell any financial instrument. The content has been prepared without consideration of your individual investment objectives, financial situation, or needs, and should not be treated as such.
Past performance is not a reliable indicator of future performance and/or results. Forward-looking scenarios or forecasts are not a guarantee of future performance. Actual results may differ materially from those anticipated.
Mitrade makes no representation or warranty as to the accuracy or completeness of the information provided and accepts no liability for any loss arising from reliance on such information.
Recommended Articles


