



Gold falls below $4,000 as Oil surge deepens weekly rout ahead of Fed
- Gold drops below $4,000, extending weekly losses to nearly 3.90%.
- WTI surges above $100 as Middle East hostilities intensify.
- December Fed hike odds reach 78% ahead of FOMC and PCE data.
Gold (XAU/USD) price prolongs its agony, tumbling by nearly 0.60% on Friday and poised to finish the week with losses as higher energy prices increase the chances that major central banks could tighten monetary policy to control inflation. At the time of writing, XAU/US floats near $4,000 after hitting a three-month low of $3,975.
XAU/USD is down nearly 4% weekly as surging energy prices reinforce global inflation risks
Bullion is set to lose almost 3.90% this week as the conflict in the Middle East escalates. Newswires reported that the US and Israel are getting ready to launch an attack on Iran after the US midterm elections, with the Islamic Revolutionary Guard Corps (IRGC) attacking shipping vessels transiting through “illegal routes” in the Strait of Hormuz. Also, the Houthis and Saudi Arabia are exchanging fire, adding to a sour market mood in the financial markets.
Data in the US were mixed, with consumer sentiment deteriorating while business activity expanded.
The University of Michigan Consumer Sentiment Index fell to a five-month low in October, from 48.1 to 48, ignited by higher energy prices and expectations that the Federal Reserve (Fed) will keep rates higher for longer. Inflation expectations remained unchanged from the previous report, though they are above the Fed’s 2% target. Consumers see inflation over the next 12 months at 4.7% and for a 5-year period at 3.5%.
S&P Global unveiled the preliminary Services and Manufacturing Purchasing Managers’ Index (PMI) for the US, which showed that manufacturing activity improved from 55.9 to 56 in October, while the services cooled from 58.8 to 57.9, as expected by analysts.
Meanwhile, geopolitics are underpinning Oil prices, with West Texas Intermediate (WTI), the US crude benchmark, climbing over 4% and back above the $100 threshold. Hence, expectations that energy prices will continue to remain high increase the odds that the Federal Reserve will hike rates to bring inflation to the 2% target.
Despite this and last week’s red-hot consumer and producer inflation, money markets had taken a rate hike off the table for next week’s Fed meeting. But for December, the chances are 78%, according to Prime Terminal.
Next week, the US docket features the Fed’s meeting on Tuesday and Wednesday, followed by the release of the Fed's preferred inflation gauge, the core Personal Consumption Expenditures (PCE) Price Index on Thursday.
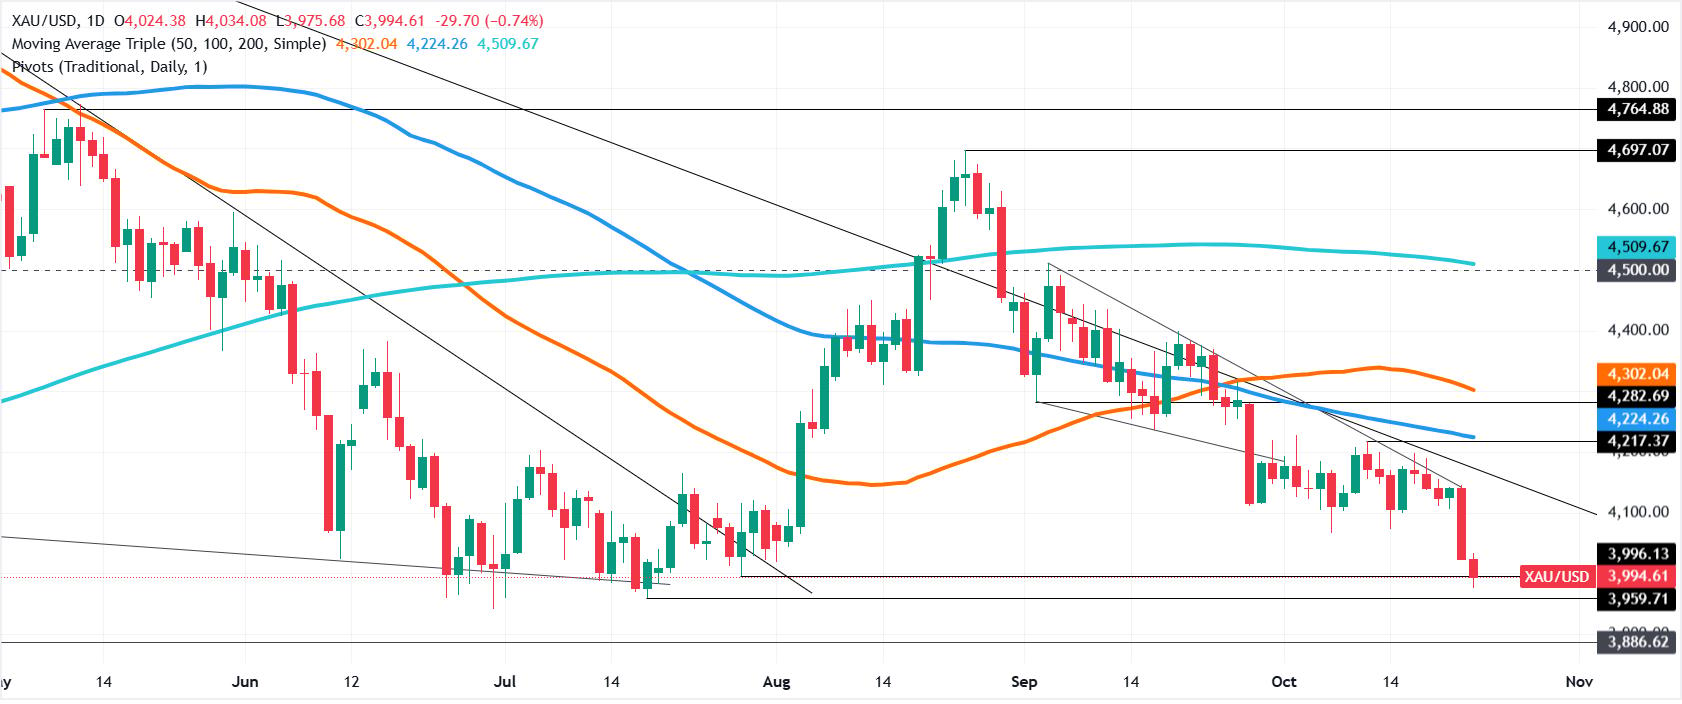
XAU/USD technical analysis: Gold sellers breach $4,000, up next is $3,900
Gold price is trading around the $4,000 level after sellers pushed bullion to a three-month low of $3,975. However, buyers are opposing resistance, pushing the yellow metal toward $4,000.
Despite this, a tug of war between bulls and bears favors the latter. First, the market structure of successive lower highs and lower lows remains intact, and momentum favors further downside, with the RSI (14) eyeing a test of oversold territory.
For a bearish continuation, the first support for XAU/USD is the day's low at $3,975. Below the next stop is the July 17 low at $3,959 and the year-to-date (YTD) low at $3,941.
On the upside, bulls must reclaim $4,10 which would expose the $4,200 mark. Once surpassed, the next stops are the 100-day Simple Moving Average (SMA) at $4,224, the 50-day SMA at $4,302, and $4,500.
Gold FAQs
Gold has played a key role in human’s history as it has been widely used as a store of value and medium of exchange. Currently, apart from its shine and usage for jewelry, the precious metal is widely seen as a safe-haven asset, meaning that it is considered a good investment during turbulent times. Gold is also widely seen as a hedge against inflation and against depreciating currencies as it doesn’t rely on any specific issuer or government.
Central banks are the biggest Gold holders. In their aim to support their currencies in turbulent times, central banks tend to diversify their reserves and buy Gold to improve the perceived strength of the economy and the currency. High Gold reserves can be a source of trust for a country’s solvency. Central banks added 1,136 tonnes of Gold worth around $70 billion to their reserves in 2022, according to data from the World Gold Council. This is the highest yearly purchase since records began. Central banks from emerging economies such as China, India and Turkey are quickly increasing their Gold reserves.
Gold has an inverse correlation with the US Dollar and US Treasuries, which are both major reserve and safe-haven assets. When the Dollar depreciates, Gold tends to rise, enabling investors and central banks to diversify their assets in turbulent times. Gold is also inversely correlated with risk assets. A rally in the stock market tends to weaken Gold price, while sell-offs in riskier markets tend to favor the precious metal.
The price can move due to a wide range of factors. Geopolitical instability or fears of a deep recession can quickly make Gold price escalate due to its safe-haven status. As a yield-less asset, Gold tends to rise with lower interest rates, while higher cost of money usually weighs down on the yellow metal. Still, most moves depend on how the US Dollar (USD) behaves as the asset is priced in dollars (XAU/USD). A strong Dollar tends to keep the price of Gold controlled, whereas a weaker Dollar is likely to push Gold prices up.
Nothing in this material constitutes investment advice, personal recommendation, investment research, an offer, or a solicitation to buy or sell any financial instrument. The content has been prepared without consideration of your individual investment objectives, financial situation, or needs, and should not be treated as such.
Past performance is not a reliable indicator of future performance and/or results. Forward-looking scenarios or forecasts are not a guarantee of future performance. Actual results may differ materially from those anticipated.
Mitrade makes no representation or warranty as to the accuracy or completeness of the information provided and accepts no liability for any loss arising from reliance on such information.
Recommended Articles


