



Palladium (XPDUSD) Volatility Intensified on Oct 15: What to Watch
Palladium (XPDUSD) is up 2.17% at Oct 15 03:10(ET), now at $1118.22, with a 7-day down of 0.61%.
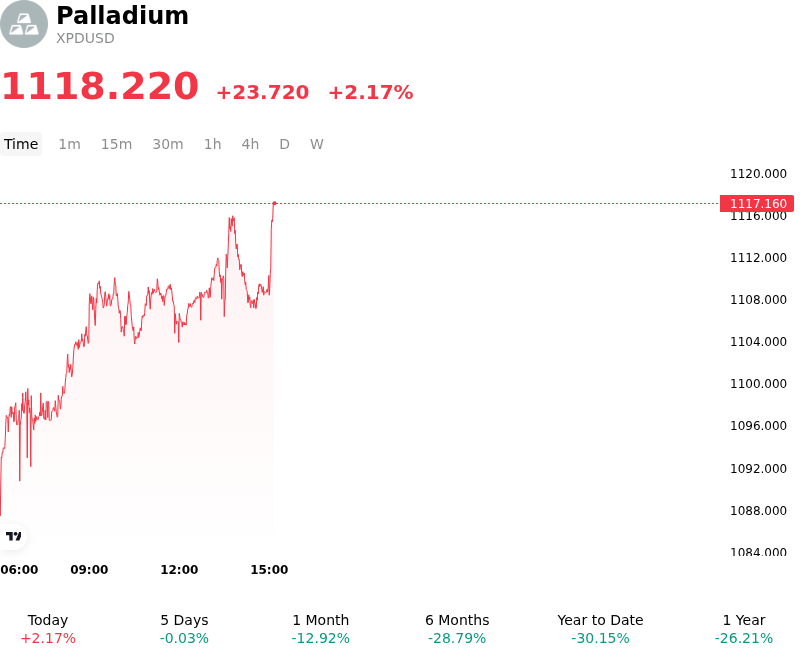
What is driving Palladium (XPDUSD)’s stock price up today?
The intraday advance in palladium was primarily driven by aggressive short-covering and technical buying, as institutional participants unwound bearish positions following recent pressure that left prices deeply oversold near multi-month support levels. Macroeconomic relief provided a crucial tailwind, characterized by a pullback in the US dollar index and a decline in benchmark Treasury yields. The resulting drop in holding costs for non-yielding metals created a favorable entry point for systematic capital flows and momentum traders, amplifying upward price momentum.
On the physical side, supply-side friction continues to underpin fundamental valuations. Mine output across primary producing regions remains constrained by operational headwinds, extended smelter maintenance, and deteriorating ore head grades in South Africa, alongside persistent logistical and trade uncertainties surrounding Russian supply flows. Because global primary production is heavily concentrated, localized processing delays and mining constraints continue to limit immediate physical availability, preventing aggressive downside expansion and supporting market balance.
From a demand perspective, near-term industrial consumption remains supported by steady auto-catalytic converter manufacturing, particularly within the hybrid vehicle segment. While structural headwinds related to long-term electric vehicle adoption persist, elevated hybrid production has helped sustain platinum-group metal consumption. Investors will continue to monitor global auto manufacturing data, potential central bank interest rate adjustments, and operational stability in primary mining regions to determine whether this rebound represents a temporary short-squeeze or a broader trend shift.
Technical Analysis of Palladium (XPDUSD)
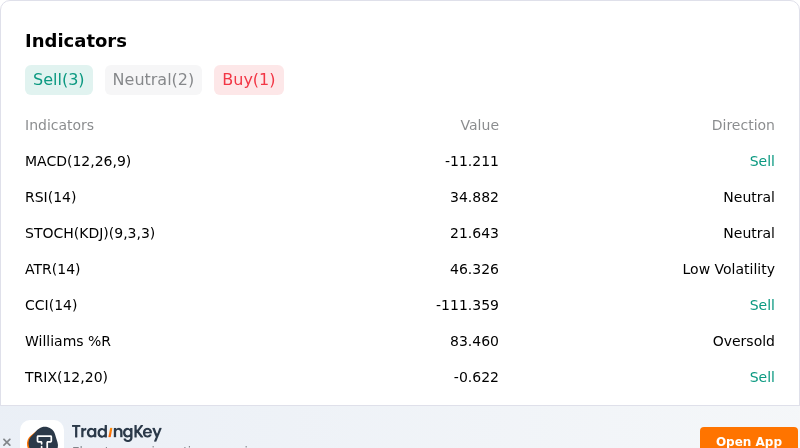
Technically, Palladium (XPDUSD) shows a MACD (12,26,9) value of -11.211, indicating a sell signal. The RSI at 34.882 suggests neutral condition and the Williams %R at 83.460 suggests oversold condition. Please monitor closely.
More details about Palladium (XPDUSD)
Recent Events and Risks:
- Automotive Demand Deterioration and EV Penetration: Palladium spot prices (XPDUSD) face renewed downside pressure near one-year lows as global automakers reduce catalytic converter consumption due to expanding battery electric vehicle adoption and platinum substitution, triggering ongoing weakness across the PGM complex.
- Accelerating Secondary Scrap Recycling Inflows: Rising secondary palladium supply from scrapped internal combustion engine vehicles, bolstered by vehicle trade-in incentives in China, is expanding recycled volumes faster than industrial manufacturing can absorb them, shifting physical market balances into a structural surplus.
- Macro Risk-Off and Hawkish Interest Rate Expectations: Resurgent U.S. dollar strength and sticky inflation indicators have heightened expectations for elevated Federal Reserve interest rates, increasing opportunity costs for holding non-yielding physical metals and fueling persistent institutional investment outflows from commodity ETFs.
- Dissipation of Import Tariff Premiums: Downside price risks remain unhedged after international trade rulings rejected anti-dumping duties on Russian unwrought palladium, removing speculative geopolitical supply-risk premiums while primary Russian and South African mine shipments remain stable.
Nothing in this material constitutes investment advice, personal recommendation, investment research, an offer, or a solicitation to buy or sell any financial instrument. The content has been prepared without consideration of your individual investment objectives, financial situation, or needs, and should not be treated as such.
Past performance is not a reliable indicator of future performance and/or results. Forward-looking scenarios or forecasts are not a guarantee of future performance. Actual results may differ materially from those anticipated.
Mitrade makes no representation or warranty as to the accuracy or completeness of the information provided and accepts no liability for any loss arising from reliance on such information.
Recommended Articles


