

CFDs are complex instruments and come with a high risk of losing money rapidly due to leverage. 83% of retail investor accounts lose money when trading CFDs with this provider. You should consider whether you understand how CFDs work and whether you can afford to take the high risk of losing your money.

Solana Price Forecast: SOL risks $100 breakdown as ETF outflows mount

Source Fxstreet
  • Solana extends losses on Thursday after retreating over 2% from its 50-day EMA at $107.13 the previous day.
  • SOL-focused ETFs recorded over $1 million in redemptions, marking their eighth consecutive day of outflows.
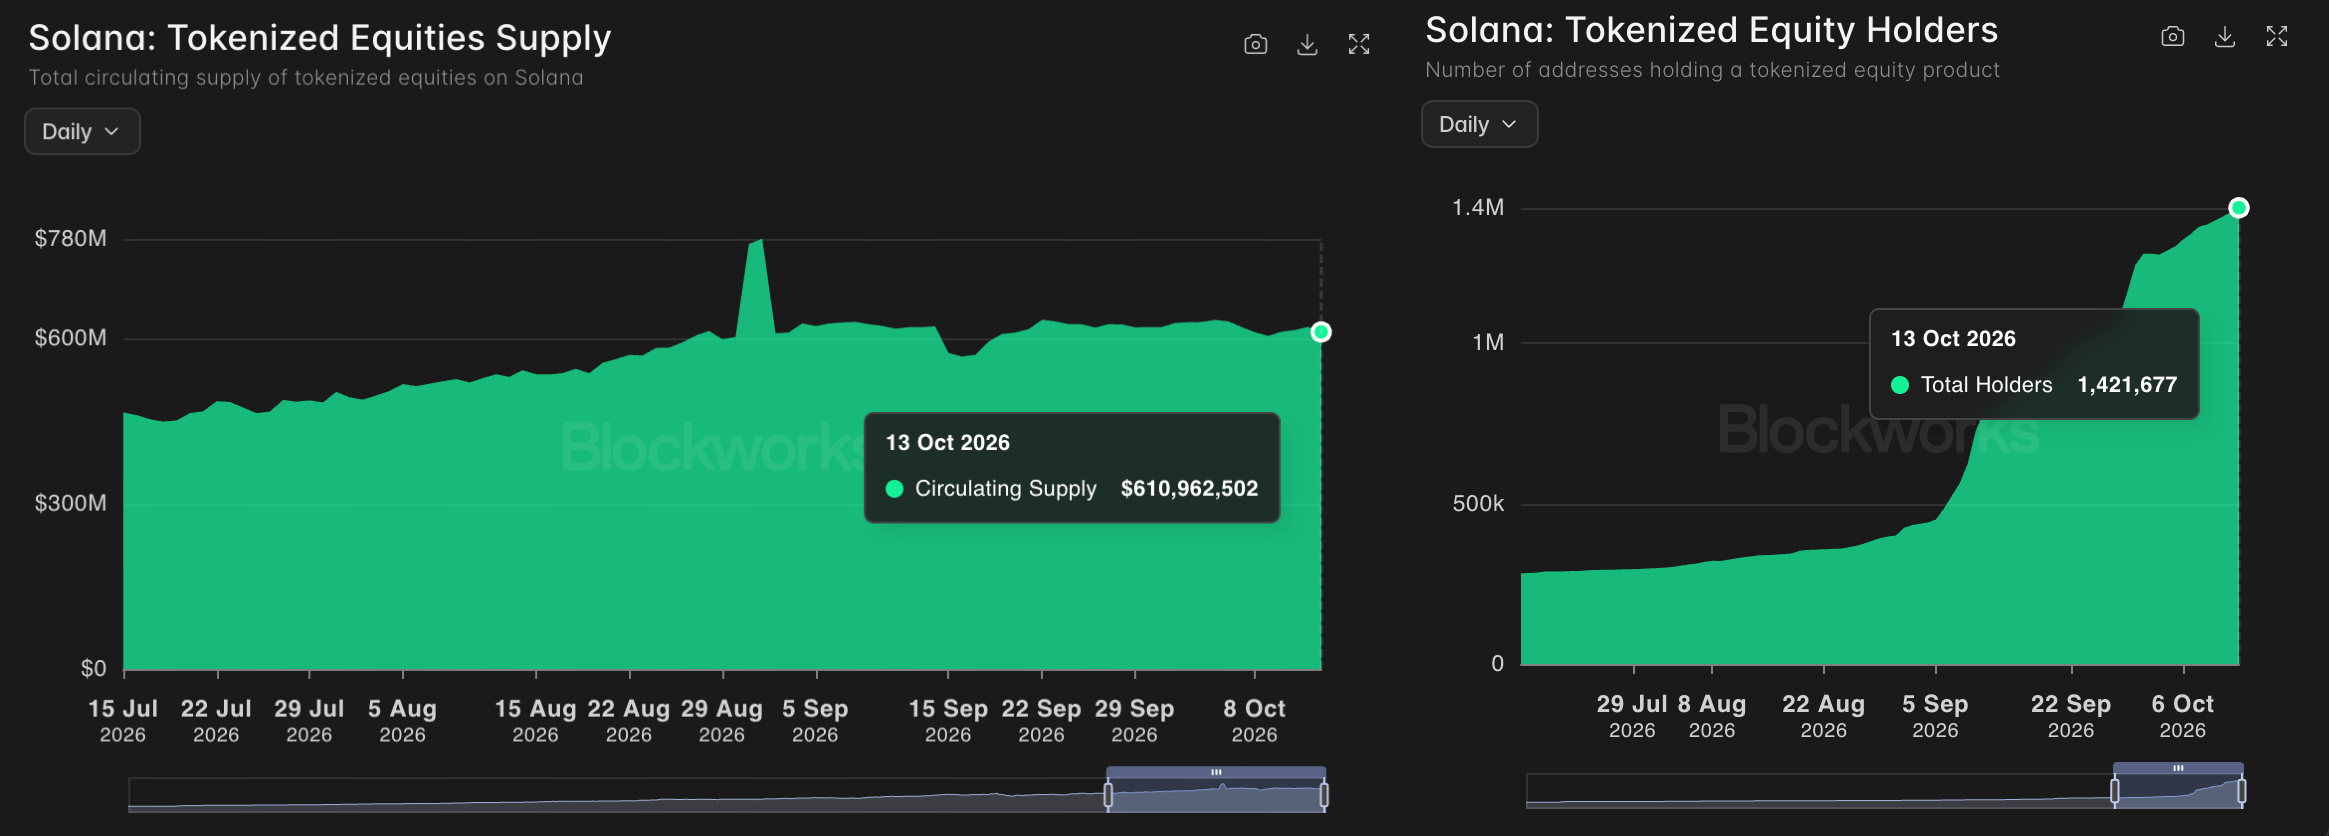
  • Solana sees steady growth in tokenized assets, with over $600 million in tokenized equity supply across 1.4 million holders.

Solana (SOL) price extends losses on Thursday, inching lower to the $100 mark after a 2% retreat from the 50-day Exponential Moving Average (EMA) at $107.13 the previous day. The institutional demand remains weak, with eight consecutive days of outflows from SOL-focused Exchange Traded Funds (ETFs). Tokenized assets rise on Solana, with over $600 million in tokenized equity supply across 1.4 million holders.

The technical outlook for Solana indicates a downside bias as bearish pressure mounts.

Solana ETFs face consistent selling pressure

Solana-focused ETFs are experiencing an extended selloff, driven by consistent investor redemptions over the last week. SoSoValue data shows SOL ETFs marked their eighth consecutive day of outflows, with $1.29 million on Wednesday and extending last week’s $24.81 million.

On the other hand, the tokenized assets on Solana are rising. Blockworks data shows tokenized equity supply rising to nearly $611 million on Tuesday, distributed across 1.42 million holders. 
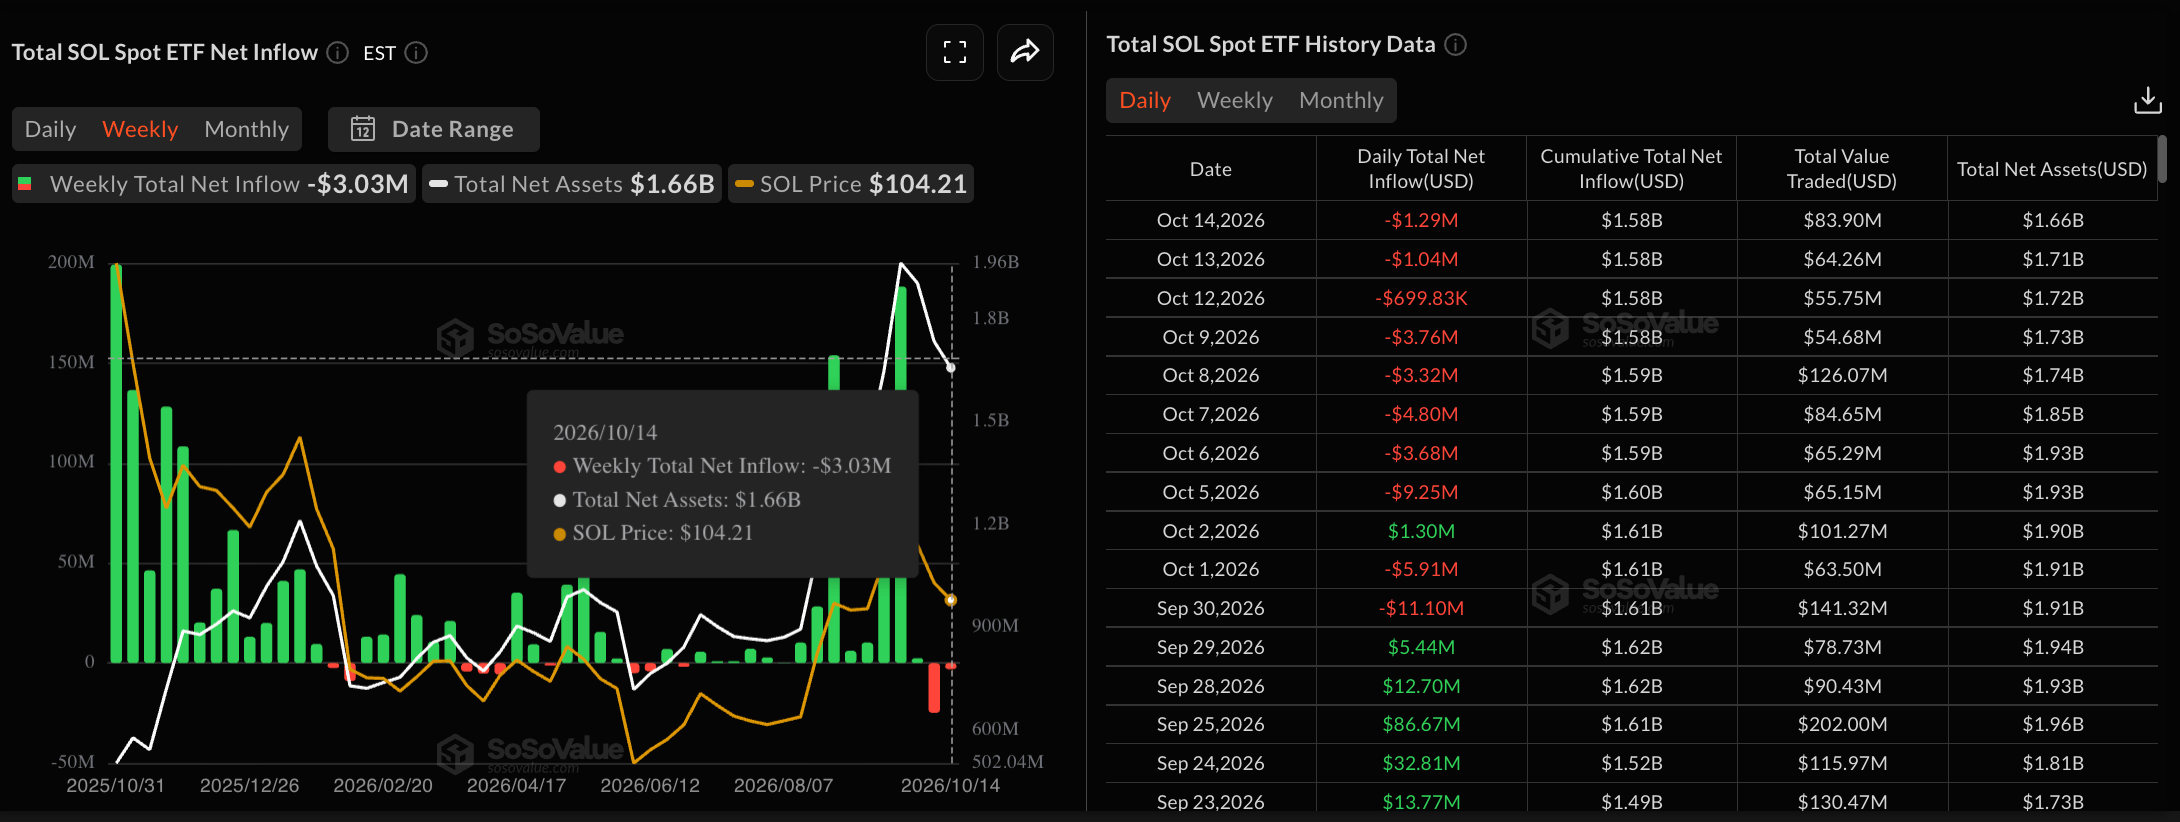
SOL ETFs data. Source: Sosovalue
Solana tokenized assets data. Source: Blockworks

Technical outlook: Could Solana's price fall below $100?

Solana trades around $102.50 at press time on Thursday, maintaining a bearish near-term bias after a double-top reversal from $122 in early October. The SOL price is down over 13% so far in October, crossing below the 50-day EMA at $107.13. Still, SOL remains above the 200-day EMA at $97.95, suggesting a corrective phase within a broader uptrend.

Downside pressure remains firm on the daily chart, with the Moving Average Convergence Divergence (MACD) below its signal and zero line, while the Relative Strength Index (RSI) near 35 suggests that sellers remain in control.

Looking down, the 200-day EMA at $97.95 offers the first meaningful support zone. A clear drop through this level would likely expose deeper losses, aligning with the May 17 high at $83.50.

Chart Analysis SOL/USDT (Binance)
SOL/USDT daily price chart.

On the flip side, initial resistance is located at the 50-day EMA around $107.13. A sustained break above this barrier would be needed to ease the current bearish tone before the more distant horizontal cap near the September 25 high at $122.94 comes into view.

(The technical analysis of this story was written with the help of an AI tool. Know more.)

Disclaimer: The content available on Mitrade Insights is provided for informational and marketing purposes only. It has not been prepared in accordance with legal requirements designed to promote the independence of investment research and is not subject to any prohibition on dealing ahead of the dissemination of investment research
Nothing in this material constitutes investment advice, personal recommendation, investment research, an offer, or a solicitation to buy or sell any financial instrument. The content has been prepared without consideration of your individual investment objectives, financial situation, or needs, and should not be treated as such.
Past performance is not a reliable indicator of future performance and/or results. Forward-looking scenarios or forecasts are not a guarantee of future performance. Actual results may differ materially from those anticipated.
Mitrade makes no representation or warranty as to the accuracy or completeness of the information provided and accepts no liability for any loss arising from reliance on such information.
placeholder
Silver Price Forecast: XAG/USD rises to near $72.50 due to bullish biasSilver price (XAG/USD) gains nearly 4%, trading around $75.50 during the European hours on Monday. The technical analysis of the daily chart timeframe suggests the price of the precious metal remains within an ascending channel pattern, suggesting a persistent bullish bias.
Author  FXStreet
Jan 05, Mon
Silver price (XAG/USD) gains nearly 4%, trading around $75.50 during the European hours on Monday. The technical analysis of the daily chart timeframe suggests the price of the precious metal remains within an ascending channel pattern, suggesting a persistent bullish bias.
placeholder
Aave Price Forecast: AAVE eyes bullish breakout as on-chain and derivatives data turns supportiveAave (AAVE) price hovers around $172 on Wednesday, nearing the upper trendline of the falling parallel channel pattern. A break above this technical pattern favors the bulls.
Author  FXStreet
Jan 07, Wed
Aave (AAVE) price hovers around $172 on Wednesday, nearing the upper trendline of the falling parallel channel pattern. A break above this technical pattern favors the bulls.
placeholder
Japan's Nikkei closes at record high as tech earnings overshadow Mideast concernsBy Rocky Swift TOKYO, April 24 (Reuters) - Japan's Nikkei set a closing record high on Friday, capping a third consecutive weekly gain, as enthusiasm over technology sector earnings offset uncertainty over a potential peace deal in the Middle East.The benchmark Nikkei 225 Index .N225 rose 0.9...
Author  Reuters
Apr 24, Fri
By Rocky Swift TOKYO, April 24 (Reuters) - Japan's Nikkei set a closing record high on Friday, capping a third consecutive weekly gain, as enthusiasm over technology sector earnings offset uncertainty over a potential peace deal in the Middle East.The benchmark Nikkei 225 Index .N225 rose 0.9...
placeholder
Silver Price Forecast: XAG/USD remains sideways around $65, FOMC takes centre stageSilver price (XAG/USD) continues to trade in a limited range at around $65.30 during the European trading session on Tuesday.
Author  FXStreet
Aug 18, Tue
Silver price (XAG/USD) continues to trade in a limited range at around $65.30 during the European trading session on Tuesday.
placeholder
Gold steadies below $4,350 as surging yields offset support from Fed rate-hold betsGold price (XAU/USD) holds steady near $4,335 after pulling back from an early-June top near $4,450 during the early Asian trading hours on Wednesday.
Author  FXStreet
Aug 19, Wed
Gold price (XAU/USD) holds steady near $4,335 after pulling back from an early-June top near $4,450 during the early Asian trading hours on Wednesday.
Related Instrument
goTop
quote