



US Dollar Index roars towards 103 as hot CPI reignite Fed hike bets
- Dollar Index jumps 0.69% as headline inflation accelerates to 3.7%.
- Core CPI rises to 2.6%, reinforcing concerns over persistent inflation.
- October Fed hike odds surge to 42%, lifting Treasury yields.
The US Dollar Index (DXY), which tracks the performance of the Greenback against a basket of six major currencies, surges over 0.69% as US inflation data trumps the Fed’s dovish rhetoric that no rate hikes are needed in 2027. The DXY is up 0.69% at 102.90
DXY surges to 102.90 as accelerating inflation drives Treasury yields higher
The US Consumer Price Index (CPI) in September exceeded estimates, with the print coming at 0.6% MoM as expected, while on an annual basis it rose from 3.4% to 3.7% YoY, above forecasts. The core CPI, which excludes volatile items like energy and food, expanded by 0.3% MoM, above projections, and, in the twelve months to September, rose from 2.4% to 2.6%, also higher than expected.
A surge in gasoline and diesel prices, as well as food prices, underpinned headline inflation. Core CPI increased due to higher costs for shelter, owner-equivalent rent, recreation, and education, as well as a jump in used-car and truck prices.
After the report, money markets increased the chances for a Fed rate hike at the October meeting. A day ago, the odds were close to 22%; at the time of writing, they surged to 42% and for 2027, investors are pricing in 54 basis points of tightening, according to Prime Terminal data.
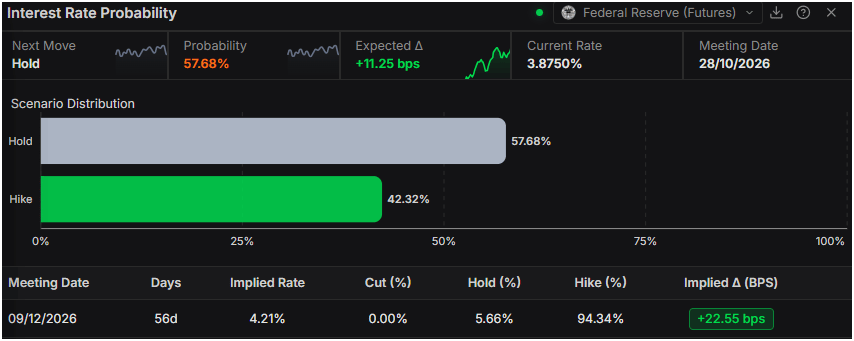
US inflation data contradicts remarks by New York Fed President John Williams on Tuesday, who said he sees another rate hike in 2026 and none in 2027.
Worth noting that US Treasury yields surged, with the 10-year T-note yielding 5.251%, up 3.5 basis points. Meanwhile, the 2-year Treasury yield, the most sensitive to changes in short-term interest rates, rose nearly 7 basis points to 4.865%.
What’s next for the US Dollar?
The economic docket will feature the Fed’s Beige Book, the release of the Producer Price Index (PPI), Retail Sales, Initial Jobless Claims, and further Fed speaking.
US Dollar Index Price Forecast: Technical outlook
In the daily chart, Dollar Index Spot trades at 102.87. The index holds a bullish near-term bias as price stands well above the 50/100/200-day simple moving average cluster near 100.25 and rides an ascending medium-term trend line that is being tested around the current level. A long-term upward trend line offering support around 101.84 sits just below price, while the Relative Strength Index (14) at 71.85 shows overbought conditions, hinting that the advance is stretched but still underpinned by strong momentum.
On the downside, immediate support is aligned with the medium-term rising trend line at 102.87, followed by the long-term ascending trend line around 101.84. A deeper pullback would target the key moving average floor near 100.25, where the 50-, 100- and 200-day simple moving averages cluster to reinforce broader bullish structure.
(The technical analysis of this story was written with the help of an AI tool. Know more.)
US Dollar Price Today
The table below shows the percentage change of US Dollar (USD) against listed major currencies today. US Dollar was the strongest against the British Pound.
| USD | EUR | GBP | JPY | CAD | AUD | NZD | CHF | |
|---|---|---|---|---|---|---|---|---|
| USD | 0.70% | 0.81% | 0.29% | 0.44% | 0.40% | 0.74% | 0.72% | |
| EUR | -0.70% | 0.11% | -0.39% | -0.22% | -0.32% | 0.01% | 0.02% | |
| GBP | -0.81% | -0.11% | -0.50% | -0.38% | -0.41% | -0.08% | -0.09% | |
| JPY | -0.29% | 0.39% | 0.50% | 0.17% | 0.11% | 0.46% | 0.44% | |
| CAD | -0.44% | 0.22% | 0.38% | -0.17% | -0.05% | 0.29% | 0.27% | |
| AUD | -0.40% | 0.32% | 0.41% | -0.11% | 0.05% | 0.34% | 0.31% | |
| NZD | -0.74% | -0.01% | 0.08% | -0.46% | -0.29% | -0.34% | -0.01% | |
| CHF | -0.72% | -0.02% | 0.09% | -0.44% | -0.27% | -0.31% | 0.00% |
The heat map shows percentage changes of major currencies against each other. The base currency is picked from the left column, while the quote currency is picked from the top row. For example, if you pick the US Dollar from the left column and move along the horizontal line to the Japanese Yen, the percentage change displayed in the box will represent USD (base)/JPY (quote).
Nothing in this material constitutes investment advice, personal recommendation, investment research, an offer, or a solicitation to buy or sell any financial instrument. The content has been prepared without consideration of your individual investment objectives, financial situation, or needs, and should not be treated as such.
Past performance is not a reliable indicator of future performance and/or results. Forward-looking scenarios or forecasts are not a guarantee of future performance. Actual results may differ materially from those anticipated.
Mitrade makes no representation or warranty as to the accuracy or completeness of the information provided and accepts no liability for any loss arising from reliance on such information.
Recommended Articles


