



Corning Inc Stock (GLW) Moved Down by 3.26% on Oct 16: Facts Behind the Movement
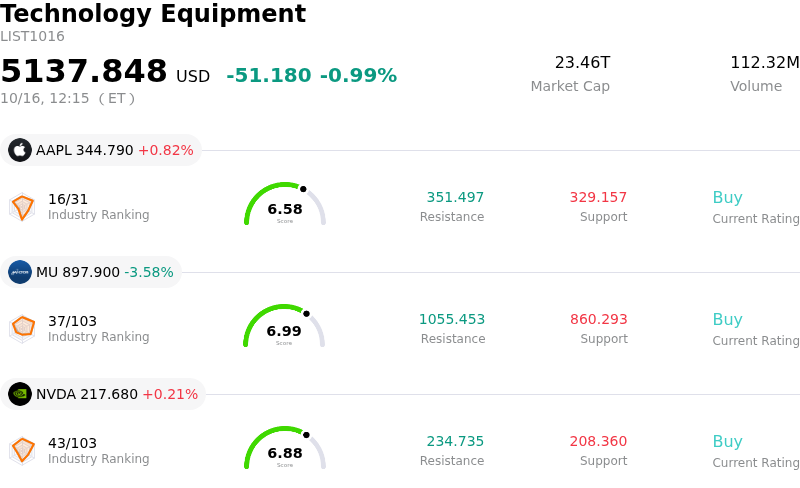
Corning Inc (GLW) moved down by 3.26%. The Technology Equipment sector is down by 0.99%. The company underperformed the industry. Top 3 stocks by turnover in the sector: Apple Inc (AAPL) up 0.80%; Micron Technology Inc (MU) down 3.65%; NVIDIA Corp (NVDA) up 0.12%.
What is driving Corning Inc (GLW)’s stock price down today?
Corning Incorporated experienced downward price momentum as market sentiment continues to digest the overhang from its multi-billion-dollar at-the-market equity distribution agreement. Announcements involving prospective share issuances typically generate dilution concerns among equity investors, leading to short-term selling pressure. Additionally, news surrounding potential shareholder investigations related to the offering disclosure has further weighed on investor sentiment, creating an unsettled environment for the stock.
The decline also reflects strategic de-risking and profit-taking by market participants ahead of the company's upcoming quarterly earnings announcement. Following a sustained rally driven by accelerating demand for optical communications equipment and artificial intelligence data center infrastructure, traders are adopting a more cautious stance. This pre-earnings position adjustment allows institutional investors to lock in gains and evaluate whether incoming financial results and management forward guidance will justify current growth expectations.
Valuation optics have further contributed to the pullback. After outperforming broader technology sector indices over past quarters, the stock trades at a premium valuation relative to its historical multiples. This elevated valuation leaves little margin for error, amplifying sensitivity to broader macroeconomic trends, interest rate expectations, and tech sector volatility. While long-term fundamentals remain supported by AI infrastructure buildouts and industrial supply chain tailwinds, near-term trading reflects a temporary reset as the market balances strong secular growth prospects against dilution and valuation risks.
Technical Analysis of Corning Inc (GLW)
Technically, Corning Inc (GLW) shows a MACD (12,26,9) value of -5.373, indicating a sell signal. The RSI at 37.013 suggests neutral condition and the Williams %R at 95.961 suggests oversold condition. Please monitor closely.
Fundamental Analysis of Corning Inc (GLW)
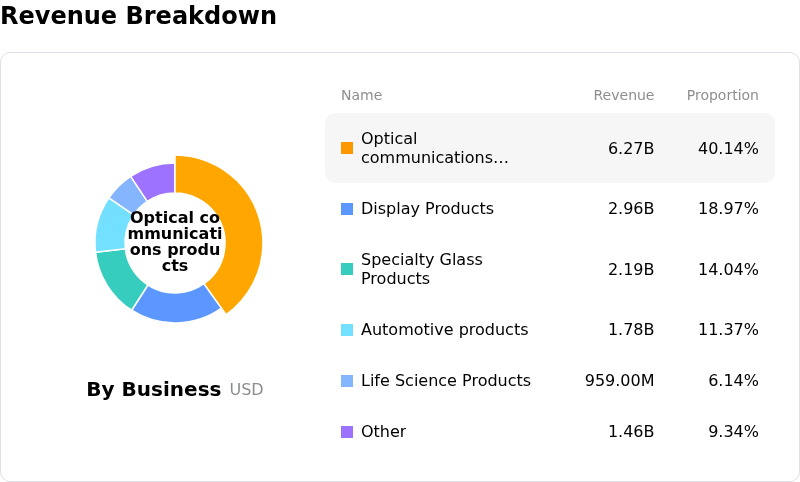
Corning Inc (GLW) is in the Technology Equipment industry. Its latest annual revenue is $15.63B, ranking 7 in the industry. The net profit is $1.60B, ranking 3 in the industry. Company Profile
Over the past month, multiple analysts have rated the company as Buy, with an average price target of $187.61, a high of $238.00, and a low of $129.00.
More details about Corning Inc (GLW)
Company Specific Risks:
- Equity Offering Dilution Overhang: Market sentiment continues to be weighed down by Corning's $2.0 billion at-the-market equity distribution agreement with Goldman Sachs, creating persistent downside pressure and concerns over potential EPS dilution from common stock sales.
- Elevated Valuation and High Pre-Earnings Threshold: Trading at an elevated trailing P/E multiple near 68x–72x, the stock faces acute downside volatility ahead of its Q3 earnings release, as institutional investors de-risk over fears that anything short of a strong beat on Q3 EPS guidance ($0.85–$0.89) will trigger a valuation reset.
- Executive Insider Share Dispositions: SEC filings highlight substantial insider selling without any offsetting insider purchases over the past year—including an Executive Vice President liquidating 46.5% of his holding—signaling executive caution at current price levels.
- Segment Profitability Friction in Solar Operations: While optical communications demand remains strong, Corning's expanding solar sub-segment recorded net operating losses due to elevated ramp-up costs, presenting a gross margin drag that threatens consolidated margin expansion goals.
Nothing in this material constitutes investment advice, personal recommendation, investment research, an offer, or a solicitation to buy or sell any financial instrument. The content has been prepared without consideration of your individual investment objectives, financial situation, or needs, and should not be treated as such.
Past performance is not a reliable indicator of future performance and/or results. Forward-looking scenarios or forecasts are not a guarantee of future performance. Actual results may differ materially from those anticipated.
Mitrade makes no representation or warranty as to the accuracy or completeness of the information provided and accepts no liability for any loss arising from reliance on such information.
Recommended Articles


