



Dollar Index slips as Fed Chair Warsh won't prejudge October
- DXY falls to its lowest since October 1 and is back under its pre-CPI level.
- Bets on an October hike fall to about 16% from near 28% on Thursday.
- No Fed official speaks from Saturday until the decision on October 28.
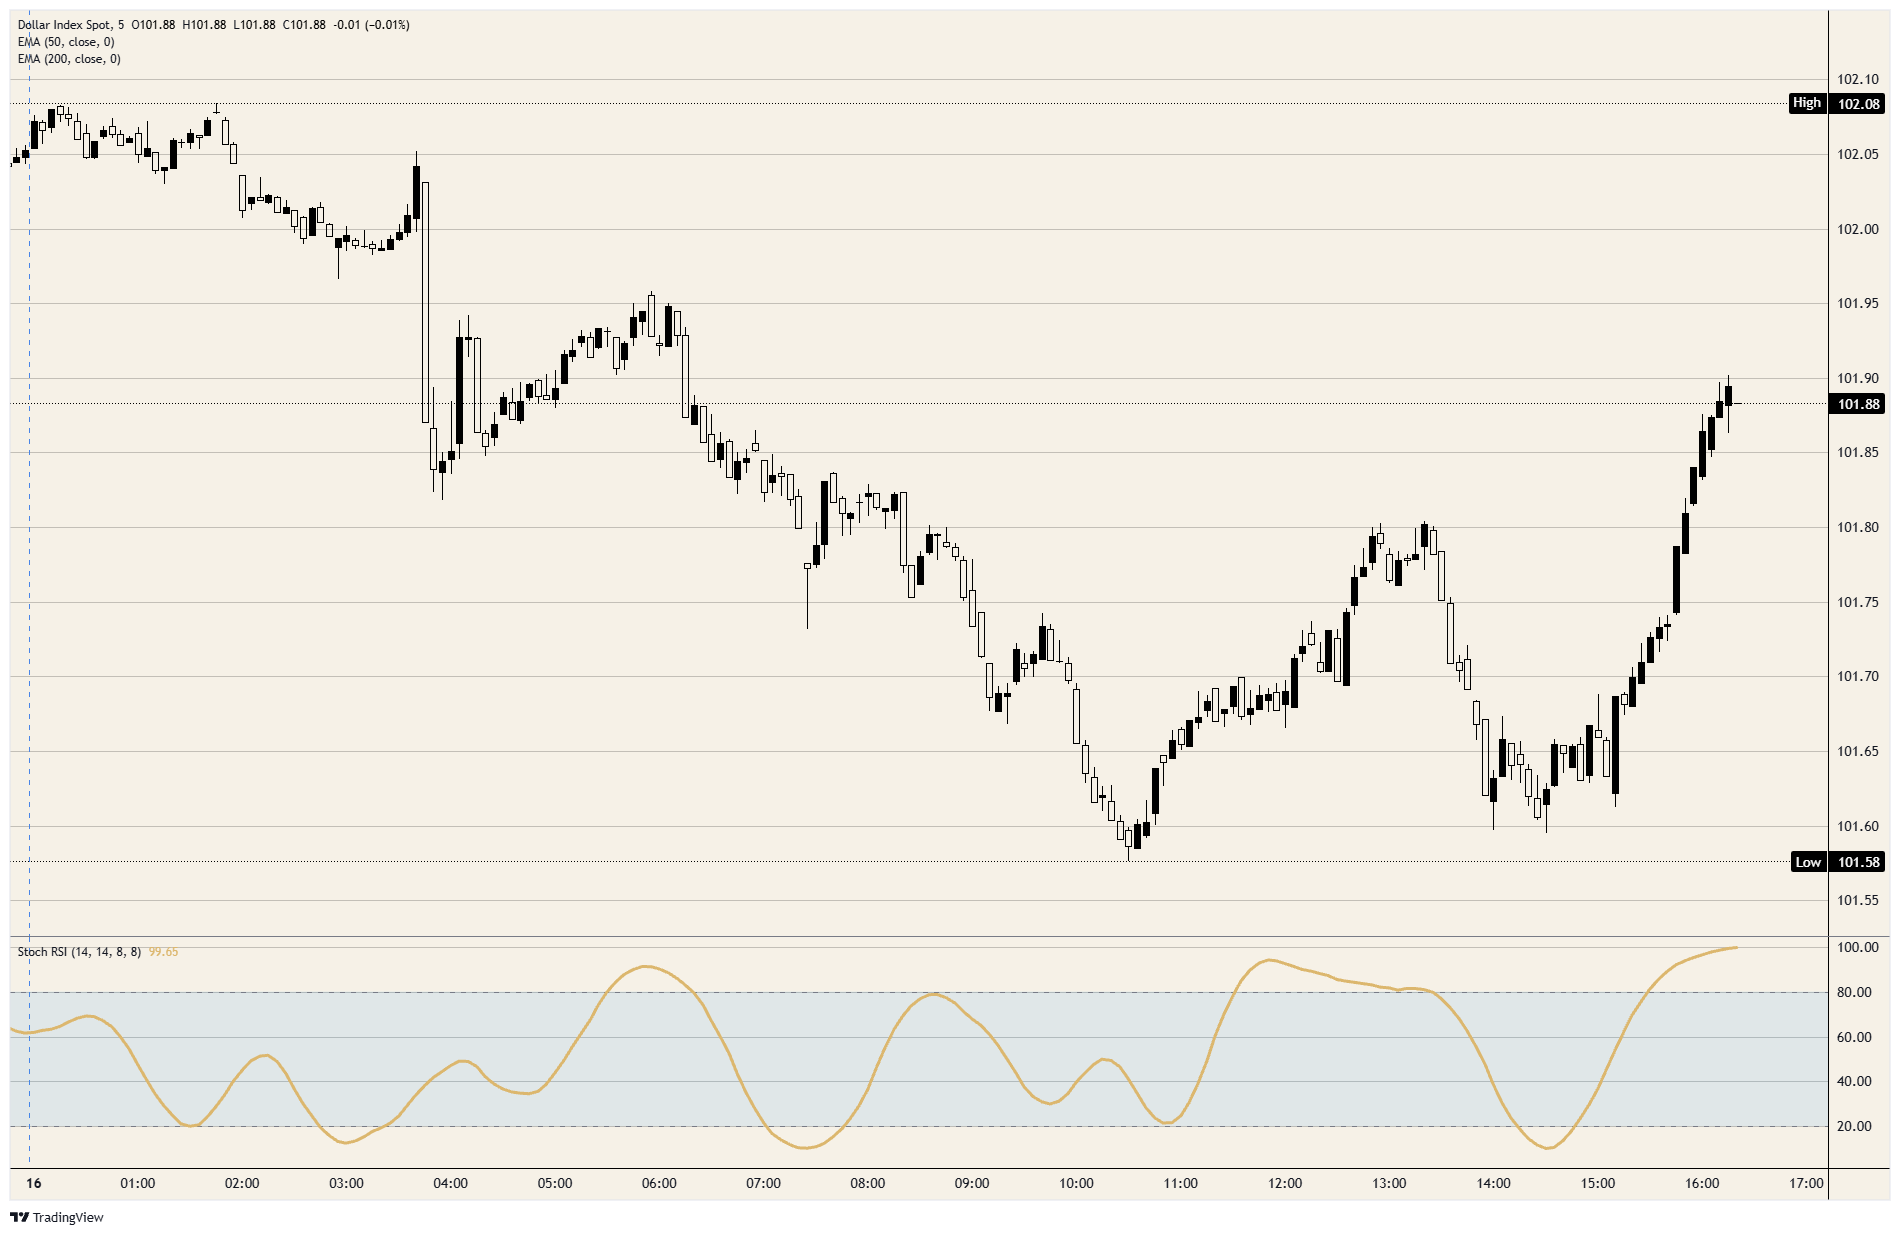
Fed Chair Warsh's last word before the quiet period was that he doesn't prejudge meetings, and the Dollar Index is lower on it, though the drop stalled near 101.60 twice. It fell from just above 102.00 to about 101.85 in one five-minute bar as he spoke, then slid to its lowest since October 1. A 0.7% rise in September industrial production, forecast at 0.4%, didn't lift it, and after a second stall as US stocks opened lower it's back where the first bar left it.
In Bangkok, Fed Chair Warsh said he'll judge October and December when he gets to them, and that the Fed is moving away from previewing decisions. Bets on an October 27-28 hike fell from near 28% to about 16% as he spoke, and the Dollar Index fell with them. That is where October was priced before Wednesday's Consumer Price Index (CPI), prejudged by everyone but the Fed.
He also welcomed most of the world raising rates at once, with no free riders, which for the Dollar Index is the other side hiking too. The European Central Bank (ECB), at 2.5% since September 10, is priced to hold on October 29 and hike in December like the Fed. The index gains when US rates rise faster than the ECB's, and the gap between 3.75%-4.00% and 2.5% is staying put.
On the calendar
Fed officials go silent from Saturday through the October 27-28 meeting, which leaves the data to move the October odds, with a December hike still priced near 90%. Friday's last US release is the monthly budget statement at 18:00 GMT.
Jobless claims land at 12:30 GMT on Thursday, October 22, forecast 200K after 199K. The October Purchasing Managers Index (PMI) surveys follow at 13:45 GMT on Friday, October 23, then Michigan consumer sentiment at 14:00 GMT, with one-year inflation expectations last at 4.7%. The expectations number is the inflation side of the December decision.
On the charts
Friday's low is under the 101.75 floor of the band the index held from October 5 until Wednesday's spike, and it has climbed back just inside. The index is on track for its first weekly loss since early September, with the 50-day Exponential Moving Average (EMA) near 100.90 about a point below. The bounce off the second low has pushed intraday momentum into overbought.
DXY 5-minute chart
US Dollar FAQs
The US Dollar (USD) is the official currency of the United States of America, and the ‘de facto’ currency of a significant number of other countries where it is found in circulation alongside local notes. It is the most heavily traded currency in the world, accounting for over 88% of all global foreign exchange turnover, or an average of $6.6 trillion in transactions per day, according to data from 2022. Following the second world war, the USD took over from the British Pound as the world’s reserve currency. For most of its history, the US Dollar was backed by Gold, until the Bretton Woods Agreement in 1971 when the Gold Standard went away.
The most important single factor impacting on the value of the US Dollar is monetary policy, which is shaped by the Federal Reserve (Fed). The Fed has two mandates: to achieve price stability (control inflation) and foster full employment. Its primary tool to achieve these two goals is by adjusting interest rates. When prices are rising too quickly and inflation is above the Fed’s 2% target, the Fed will raise rates, which helps the USD value. When inflation falls below 2% or the Unemployment Rate is too high, the Fed may lower interest rates, which weighs on the Greenback.
In extreme situations, the Federal Reserve can also print more Dollars and enact quantitative easing (QE). QE is the process by which the Fed substantially increases the flow of credit in a stuck financial system. It is a non-standard policy measure used when credit has dried up because banks will not lend to each other (out of the fear of counterparty default). It is a last resort when simply lowering interest rates is unlikely to achieve the necessary result. It was the Fed’s weapon of choice to combat the credit crunch that occurred during the Great Financial Crisis in 2008. It involves the Fed printing more Dollars and using them to buy US government bonds predominantly from financial institutions. QE usually leads to a weaker US Dollar.
Quantitative tightening (QT) is the reverse process whereby the Federal Reserve stops buying bonds from financial institutions and does not reinvest the principal from the bonds it holds maturing in new purchases. It is usually positive for the US Dollar.
Nothing in this material constitutes investment advice, personal recommendation, investment research, an offer, or a solicitation to buy or sell any financial instrument. The content has been prepared without consideration of your individual investment objectives, financial situation, or needs, and should not be treated as such.
Past performance is not a reliable indicator of future performance and/or results. Forward-looking scenarios or forecasts are not a guarantee of future performance. Actual results may differ materially from those anticipated.
Mitrade makes no representation or warranty as to the accuracy or completeness of the information provided and accepts no liability for any loss arising from reliance on such information.
Recommended Articles


