



Equinor ASA Stock (EQNR) Moved Up by 3.92% on Oct 16: Drivers Behind the Movement
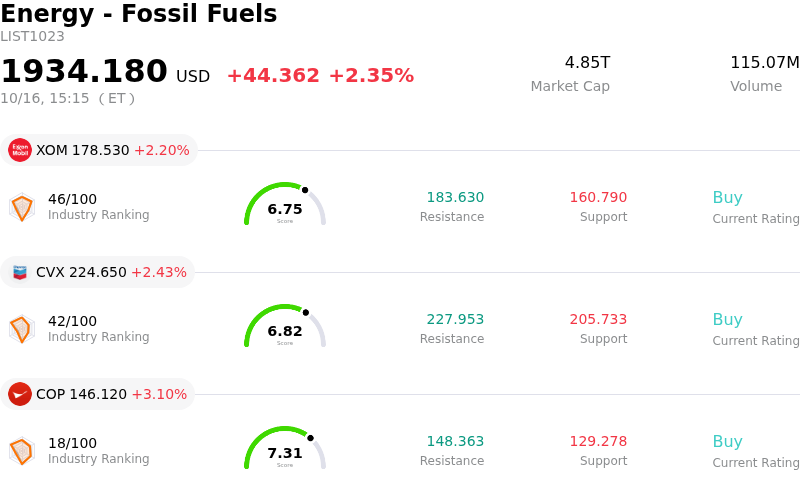
Equinor ASA (EQNR) moved up by 3.92%. The Energy - Fossil Fuels sector is up by 2.35%. The company outperformed the industry. Top 3 stocks by turnover in the sector: Exxon Mobil Corp (XOM) up 2.20%; Chevron Corp (CVX) up 2.43%; ConocoPhillips (COP) up 3.10%.
What is driving Equinor ASA (EQNR)’s stock price up today?
Equinor ASA experienced strong upward momentum during the trading session, touching a new multi-month high as bullish sentiment swept across European energy producers. The primary catalyst driving the rally centers on robust underlying cash flow expectations, supported by favorable European natural gas price dynamics and high-margin oil production. Institutional interest has intensified as market participants digest a series of positive operational updates and strategic capital allocation moves that reinforce Equinor's status as a critical energy supplier for Europe.
A significant operational factor supporting recent gains is management's strategic decision to prioritize immediate production continuity over capital-intensive short-term emissions projects. By opting to forego additional compressor installations on the Troll C platform, Equinor ensures uninterrupted output from Europe's primary natural gas field during upcoming high-demand winter cycles. This operational decision is complemented by the recent high-profile Grimsnes oil and gas discovery near the Oseberg field, which provides substantial recoverable reserves that can be fast-tracked using existing offshore infrastructure. Wall Street analysts have responded positively to these developments, with major brokerages raising price targets based on expanding free cash flow potential and firming gas pricing expectations.
Furthermore, Equinor's capital return framework continues to provide structural support to its equity valuation. The company has been actively executing its multi-billion-dollar share buyback program, consistently purchasing shares in the open market under its current tranche. Supported by a healthy balance sheet, reduced net debt, and a competitive dividend yield, Equinor presents a compelling risk-reward profile for institutional investors seeking cash generation paired with commodity upside. While long-term energy transition costs and broader macroeconomic volatility remain key watch items, current price action remains firmly anchored to strong operational execution and tight European energy supply dynamics.
Technical Analysis of Equinor ASA (EQNR)
Technically, Equinor ASA (EQNR) shows a MACD (12,26,9) value of 0.731, indicating a buy signal. The RSI at 66.828 suggests neutral condition and the Williams %R at 0.608 suggests overbought condition. Please monitor closely.
Fundamental Analysis of Equinor ASA (EQNR)
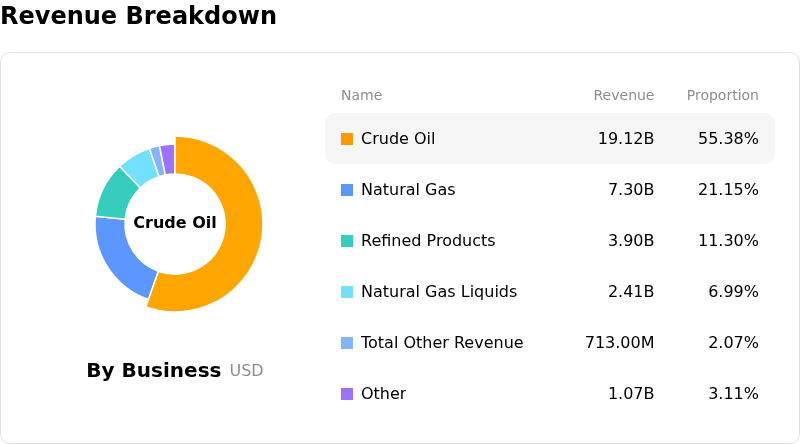
Equinor ASA (EQNR) is in the Energy - Fossil Fuels industry. Its latest annual revenue is $105.83B, ranking 9 in the industry. The net profit is $5.04B, ranking 9 in the industry. Company Profile
Over the past month, multiple analysts have rated the company as Hold, with an average price target of $40.10, a high of $51.00, and a low of $33.12.
More details about Equinor ASA (EQNR)
Company Specific Risks:
- Emissions and Project Cancellation Exposure: Equinor announced the cancellation of a second electric export compressor on the Troll C North Sea platform to prioritize short-term gas output, exposing the firm to increased regulatory scrutiny, higher carbon tax liabilities, and potential friction with European decarbonization mandates.
- Valuation Stretch Near 52-Week Highs: Wall Street consensus and equity valuation models indicate the stock is trading 18% to 23% above its intrinsic fair value, creating notable downside vulnerability and intraday price volatility as momentum stalls near 52-week peak levels.
- Institutional Profit-Taking and Order Imbalance: Market metrics indicate pronounced intraday sell order pressure and institutional position-trimming following a major multi-month rally, driven by funds taking profits ahead of the upcoming quarterly earnings release.
- Regional Regulatory and Project Permitting Friction: Management statements regarding UK and European offshore operations highlight worsening political and environmental approval delays, threatening planned asset expansion and heightening capital allocation uncertainty across core North Sea fields.
Nothing in this material constitutes investment advice, personal recommendation, investment research, an offer, or a solicitation to buy or sell any financial instrument. The content has been prepared without consideration of your individual investment objectives, financial situation, or needs, and should not be treated as such.
Past performance is not a reliable indicator of future performance and/or results. Forward-looking scenarios or forecasts are not a guarantee of future performance. Actual results may differ materially from those anticipated.
Mitrade makes no representation or warranty as to the accuracy or completeness of the information provided and accepts no liability for any loss arising from reliance on such information.
Recommended Articles


