



Gold stumbles as US yields eclipse fading October Fed hike bets
- Gold slips near $4,150, heading for a weekly loss.
- US CPI hit 3.7%, while producer inflation surged to 6.3% in September.
- October Fed hike odds fall to 16%, but December remains at 89%.
Gold (XAU/USD) price retreats about 0.10%, trading at $4,163 on Friday, poised for a weekly loss as traders assess recent US inflation data, which, although hotter than foreseen, led investors to trim their hawkish bets for the Federal Open Market Committee (FOMC) October meeting.
XAU/USD struggles near $4,160 as elevated Treasury yields offset reduced Fed tightening expectations
This week, US inflation data was the highlight of the economic docket, with both figures, the Consumer Price Index (CPI) for September rising 3.7% YoY above estimates of 3.6% and up from August’s 3.4%, while the Producer Price Index (PPI) crushed forecasts of 5.3%, rising 6.3% YoY.
Market participants increased the odds of a Fed rate hike this month post-the CPI release, near 60%. However, as the session progressed, most investment banks updated their forecasts, with most confident for a hike in December.
Money markets have priced in a 16% chance of a 25 bps move by the FOMC at the October meeting, but for December, the odds are high at 89%, according to Prime Terminal.
Meanwhile, Fed Chair Kevin Warsh disappointed investors by not providing guidance on future interest rates, though he recognized the strength of the US economy.
Bullion has failed to rally despite investors using it as an inflation hedge, as surging US Treasury yields have undermined the yellow metal.
The US 10-year Treasury yield is gaining three basis points, up to 5.106%, but it has failed to boost the Greenback, amid a scenario of higher rates in the US.
The US Dollar Index (DXY), which measures the buck’s performance against six currencies, is down 0.10% at 101.87.
On the data front, Industrial Production rose 0.7% MoM in September, exceeding estimates of 0.4% and the prior month’s 0.1% expansion.
Next week, the US economic schedule will feature housing data, Initial Jobless Claims, and Flash PMIs, which are closely watched by investors.
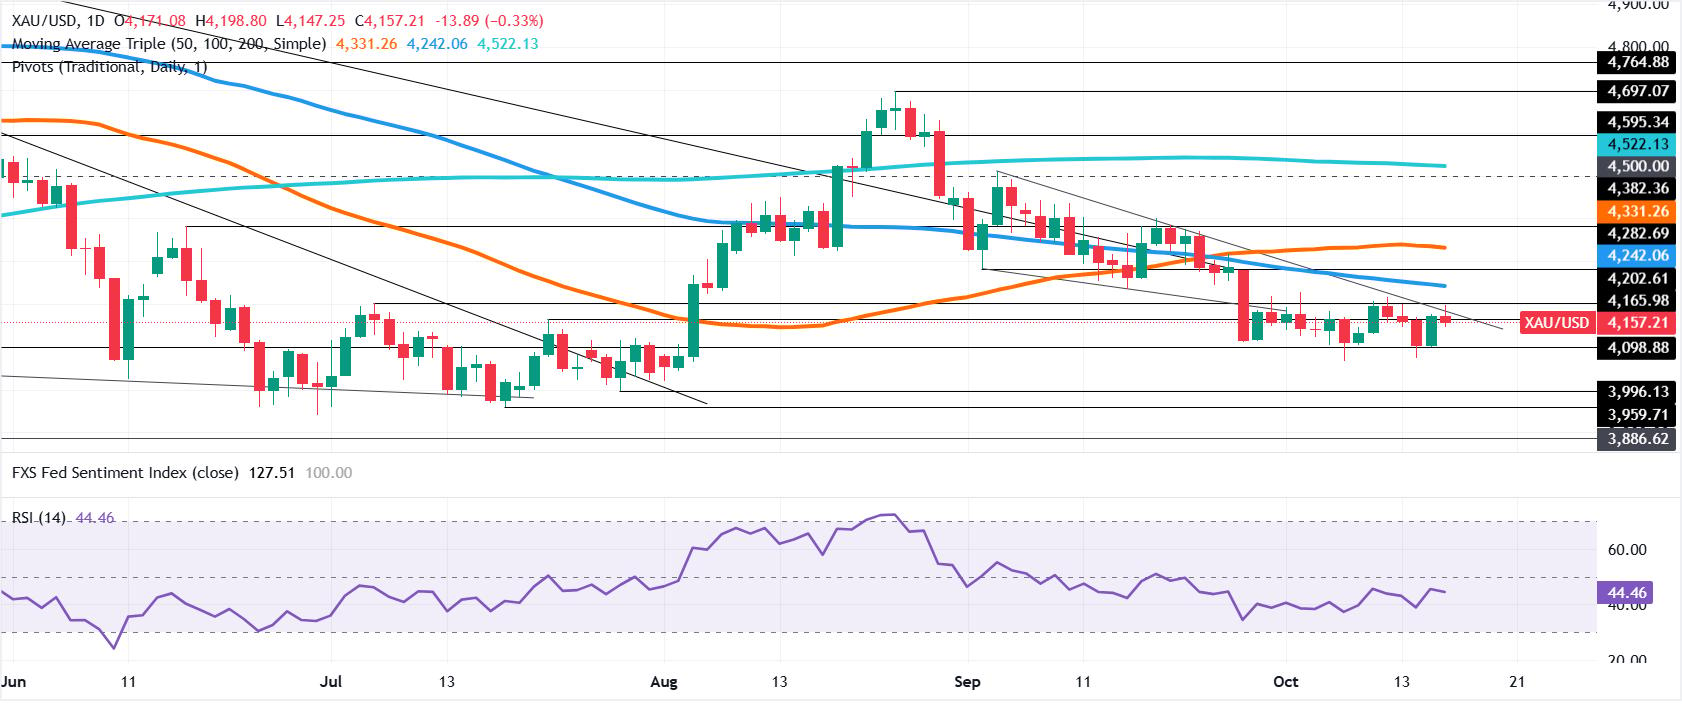
XAU/USD technical analysis: Gold remains unable to clear $4,200, dives towards $4,100
Gold continues to trade sideways within the $4,100-$4,200 range and appears to have bottomed near the range low.
Momentum-wise, the Relative Strength Index (RSI) is bearish; there’s a mild positive divergence which could open the door for further upside.
For a bullish reversal, the first resistance for XAU/USD would be $4,200, followed by a test of the 100-day Simple Moving Average (SMA) at $4,242. Above, the 50-day SMA sits at $4,331, followed by the $4,500 mark.
If XAU/USD continues lower, initial support is at $4,100. A decisive break below that level would bring the October 14 low of $4,073 into view, followed by the July 29 cycle low at $3,996 and the July 17 low at $3,959. The yearly low at $3,941 lies below those levels.
Gold FAQs
Gold has played a key role in human’s history as it has been widely used as a store of value and medium of exchange. Currently, apart from its shine and usage for jewelry, the precious metal is widely seen as a safe-haven asset, meaning that it is considered a good investment during turbulent times. Gold is also widely seen as a hedge against inflation and against depreciating currencies as it doesn’t rely on any specific issuer or government.
Central banks are the biggest Gold holders. In their aim to support their currencies in turbulent times, central banks tend to diversify their reserves and buy Gold to improve the perceived strength of the economy and the currency. High Gold reserves can be a source of trust for a country’s solvency. Central banks added 1,136 tonnes of Gold worth around $70 billion to their reserves in 2022, according to data from the World Gold Council. This is the highest yearly purchase since records began. Central banks from emerging economies such as China, India and Turkey are quickly increasing their Gold reserves.
Gold has an inverse correlation with the US Dollar and US Treasuries, which are both major reserve and safe-haven assets. When the Dollar depreciates, Gold tends to rise, enabling investors and central banks to diversify their assets in turbulent times. Gold is also inversely correlated with risk assets. A rally in the stock market tends to weaken Gold price, while sell-offs in riskier markets tend to favor the precious metal.
The price can move due to a wide range of factors. Geopolitical instability or fears of a deep recession can quickly make Gold price escalate due to its safe-haven status. As a yield-less asset, Gold tends to rise with lower interest rates, while higher cost of money usually weighs down on the yellow metal. Still, most moves depend on how the US Dollar (USD) behaves as the asset is priced in dollars (XAU/USD). A strong Dollar tends to keep the price of Gold controlled, whereas a weaker Dollar is likely to push Gold prices up.
Nothing in this material constitutes investment advice, personal recommendation, investment research, an offer, or a solicitation to buy or sell any financial instrument. The content has been prepared without consideration of your individual investment objectives, financial situation, or needs, and should not be treated as such.
Past performance is not a reliable indicator of future performance and/or results. Forward-looking scenarios or forecasts are not a guarantee of future performance. Actual results may differ materially from those anticipated.
Mitrade makes no representation or warranty as to the accuracy or completeness of the information provided and accepts no liability for any loss arising from reliance on such information.
Recommended Articles


