



AT&T Inc Stock (T) Opened Down by 4.57% on Oct 23: Drivers Behind the Movement
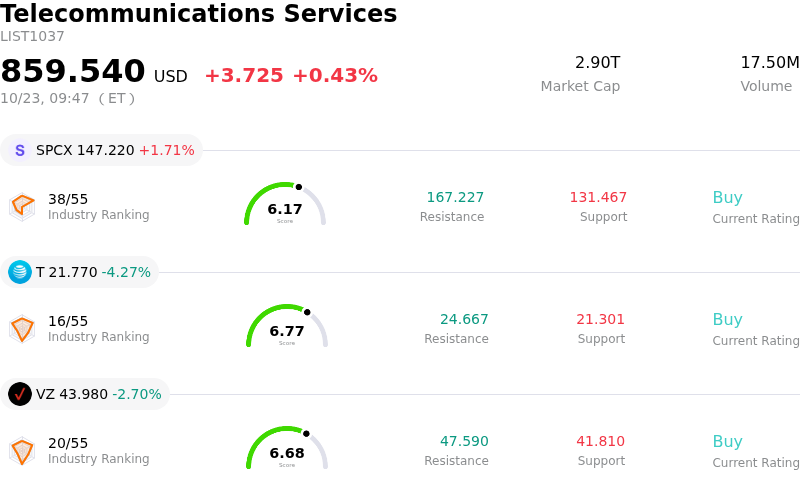
AT&T Inc (T) opened down by 4.57%. The Telecommunications Services sector is up by 0.43%. The company underperformed the industry. Top 3 stocks by turnover in the sector: SpaceX (SPCX) up 1.77%; AT&T Inc (T) down 4.57%; Verizon Communications Inc (VZ) down 2.78%.
What is driving AT&T Inc (T)’s stock price down today?
AT&T experienced downside pressure following its third-quarter financial report, as market participants weighed headline operational beats against underlying balance sheet burdens. The telecommunications giant topped consensus expectations for both revenue and adjusted earnings per share, driven by subscriber momentum in advanced connectivity, including record broadband additions across fiber and fixed wireless offerings. Management further supported sentiment by raising its full-year adjusted earnings forecast and maintaining its target for robust free cash flow generation and capital returns. However, the broader market looked past these top-line figures to focus on significant GAAP earnings dilution and balance sheet leverage.
A primary factor dragging down the stock was the heavy hit to GAAP profitability caused by a massive non-cash impairment charge related to the held-for-sale Mexican wireless operations, alongside employee separation expenses. In addition, investors reacted negatively to a sequential rise in net debt following the finalized acquisition of spectrum assets from EchoStar. The resulting increase in leverage extended management's projected timeline for returning to its target debt ratio into 2029. In a high-interest-rate environment, the persistent debt load and delayed deleveraging timeline served as a key deterrent for risk-sensitive institutional investors.
Sector dynamics and competitive friction also contributed to the selling pressure. Traders expressed growing apprehension over elevated customer acquisition costs and promotional pricing needed to retain wireless subscribers amid aggressive industry competition. Concerns regarding potential long-term disruption from direct-to-cell satellite networks further dampened valuation multiples. Consequently, despite strong free cash flow and a high dividend yield, the market prioritized balance sheet constraints and margin headwinds over short-term earnings beats, triggering the retreat in share price.
Technical Analysis of AT&T Inc (T)
Technically, AT&T Inc (T) shows a MACD (12,26,9) value of -0.240, indicating a sell signal. The RSI at 35.672 suggests neutral condition and the Williams %R at 93.251 suggests oversold condition. Please monitor closely.
Media Coverage of AT&T Inc (T)
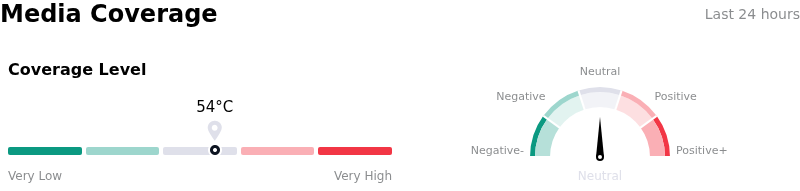
In terms of media coverage, AT&T Inc (T) shows a coverage score of 54, indicating a moderate level of media attention. The overall market sentiment index is currently in neutral zone.
Fundamental Analysis of AT&T Inc (T)
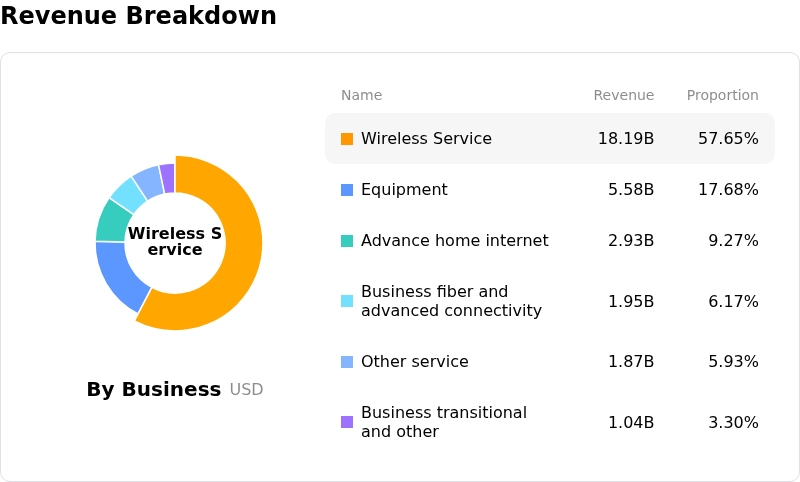
AT&T Inc (T) is in the Telecommunications Services industry. Its latest annual revenue is $125.65B, ranking 2 in the industry. The net profit is $21.89B, ranking 1 in the industry. Company Profile
Over the past month, multiple analysts have rated the company as Buy, with an average price target of $28.50, a high of $36.00, and a low of $20.00.
More details about AT&T Inc (T)
Company Specific Risks:
- Subpar Wireless Subscriber Growth and Rising Churn: AT&T reported Q3 2026 postpaid phone net additions of 379,000, missing consensus estimates of approximately 387,000 and decelerating from 432,000 in Q2. Concurrently, postpaid phone churn rose to 0.92% from 0.86% in the previous quarter, indicating that promotional discounting is eroding profitability without effectively stemming customer defections.
- Escalating Debt Burden and Deleveraging Delays: Net debt climbed to $149.8 billion, driven by a $23 billion debt obligation tied to spectrum license acquisitions from EchoStar. This expanded balance sheet elevates financing costs and complicates AT&T's timeline to reduce debt back to its target net leverage ratio of 2.5x by 2029.
- Severe GAAP Earnings Shortfall from Asset Impairments: Third-quarter GAAP earnings per share fell to $0.12, missing Wall Street consensus estimates of $0.62 by over 80%. Headline profitability was heavily dragged down by substantial non-cash write-downs related to the sale of its Mexico operational unit as well as employee separation costs.
- Emerging Competition from Direct-to-Cell Satellite Networks: The stock remains subject to competitive uncertainty sparked by SpaceX's $8 billion acquisition of nationwide 800 MHz low-band spectrum for Starlink Mobile. This direct-to-device threat—coupled with recent analyst downgrades such as Bernstein moving to Market Perform—threatens legacy carrier rural coverage premiums and long-term subscriber pricing power.
Nothing in this material constitutes investment advice, personal recommendation, investment research, an offer, or a solicitation to buy or sell any financial instrument. The content has been prepared without consideration of your individual investment objectives, financial situation, or needs, and should not be treated as such.
Past performance is not a reliable indicator of future performance and/or results. Forward-looking scenarios or forecasts are not a guarantee of future performance. Actual results may differ materially from those anticipated.
Mitrade makes no representation or warranty as to the accuracy or completeness of the information provided and accepts no liability for any loss arising from reliance on such information.
Recommended Articles


