



General Electric Co Stock (GE) Opened Down by 3.80% on Oct 23: Drivers Behind the Movement
General Electric Co (GE) opened down by 3.80%. The Industrial Goods sector is down by 1.57%. The company underperformed the industry. Top 3 stocks by turnover in the sector: Bloom Energy Corp (BE) down 8.87%; Caterpillar Inc (CAT) down 1.78%; General Electric Co (GE) down 3.80%.
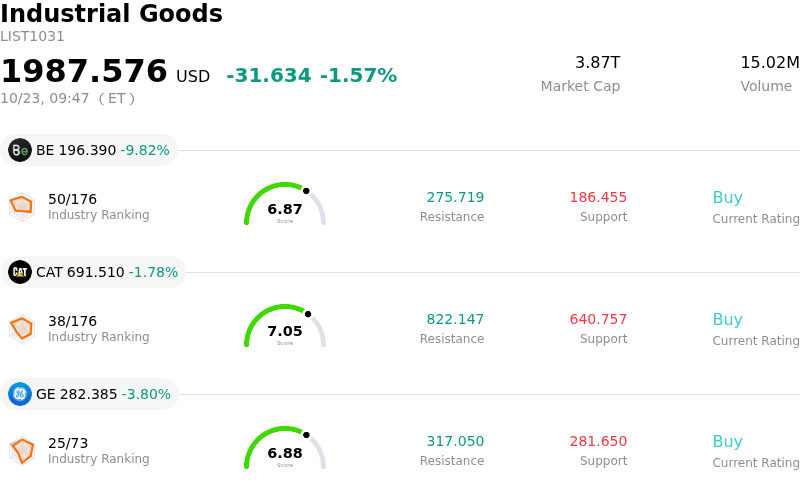
What is driving General Electric Co (GE)’s stock price down today?
GE Aerospace experienced sell-side pressure despite delivering a third-quarter earnings report that surpassed Wall Street consensus estimates on both revenue and adjusted earnings per share. The company boosted its full-year guidance across revenue, operating profit, adjusted earnings, and free cash flow, supported by commercial engine service demand and a substantial order backlog. However, the market reaction reflected a classic beat-and-raise sell-off, as elevated valuation multiples heading into the release left little room for error, triggering institutional profit-taking following a prolonged rally.
Underneath the headline figures, specific operational data points tempered investor enthusiasm. Quarterly free cash flow experienced a year-over-year decline, while persistent supply chain constraints and ongoing cost inflation continued to impact output fulfillment. Additionally, margin pressures within select business segments and losses in legacy run-off operations raised concerns regarding near-term cost structure efficiencies. Investors also evaluated the premium valuation relative to projected growth rates, leading to tactical portfolio adjustments.
Broader macroeconomic and sector-wide dynamics further exacerbated the downward movement. Rising energy costs and geopolitical tensions created headwinds for commercial airline operators, sparking broader concerns over future capacity adjustments and fleet utilization rates. Simultaneously, broader risk-off market sentiment pressured high-flying industrial and aerospace equities. While long-term fundamentals remain supported by strong engine order backlogs and defense demand, short-term trading dynamics favor profit realization over immediate accumulation.
Technical Analysis of General Electric Co (GE)
Technically, General Electric Co (GE) shows a MACD (12,26,9) value of -2.762, indicating a sell signal. The RSI at 24.524 suggests sell condition and the Williams %R at 90.397 suggests oversold condition. Please monitor closely.
Media Coverage of General Electric Co (GE)
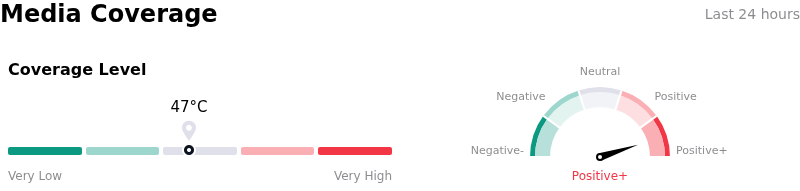
In terms of media coverage, General Electric Co (GE) shows a coverage score of 47, indicating a moderate level of media attention. The overall market sentiment index is currently in extremely bullish zone.
Fundamental Analysis of General Electric Co (GE)
General Electric Co (GE) is in the Industrial Goods industry. Its latest annual revenue is $45.85B, ranking 5 in the industry. The net profit is $8.70B, ranking 1 in the industry. Company Profile
Over the past month, multiple analysts have rated the company as Buy, with an average price target of $390.21, a high of $435.00, and a low of $305.00.
More details about General Electric Co (GE)
Company Specific Risks:
- Weak Implied Fourth-Quarter Outlook: Despite beating Q3 2026 earnings expectations, GE Aerospace's updated full-year guidance implies a fourth-quarter adjusted EPS of $1.87 to $1.97, falling approximately 6% below Wall Street consensus forecasts of $2.04. This softer near-term trajectory triggered immediate stock selloffs and prompted analyst price target reductions across major research firms.
- Surging Engine-Service Costs and Cash Flow Decline: Escalating engine-service allowances, durability reserves, and input inflation drove a 14% year-over-year decline in Q3 free cash flow to $2.04 billion. Unfavorable product mix and persistent cost inflation also compressed operating margins in the core Commercial Engines & Services segment by 10 basis points.
- GE9X Program Ramp Drag and Certification Dependencies: Management projected an estimated $300 million profit headwind in 2027 associated with scaling GE9X engine production for Boeing's 777X program. In addition, deferred revenue recognition on GE9X engines remains dependent on obtaining FAA certification for upgraded engine midseals.
- Supply Chain Bottlenecks and Parts Delinquencies: Operational execution continues to be hampered by broader aerospace supply chain constraints and increasing spare parts delinquency. These ongoing material shortages present risks to internal shop visit turnaround times and customer engine delivery schedules.
Nothing in this material constitutes investment advice, personal recommendation, investment research, an offer, or a solicitation to buy or sell any financial instrument. The content has been prepared without consideration of your individual investment objectives, financial situation, or needs, and should not be treated as such.
Past performance is not a reliable indicator of future performance and/or results. Forward-looking scenarios or forecasts are not a guarantee of future performance. Actual results may differ materially from those anticipated.
Mitrade makes no representation or warranty as to the accuracy or completeness of the information provided and accepts no liability for any loss arising from reliance on such information.
Recommended Articles


