



USD/CHF (USDCHF) Drops 0.56% on Oct 30: What You Need to Watch
USD/CHF (USDCHF) is down 0.56% at Oct 30 21:20(ET), now at $0.81935, with a 7-day down of 0.60%.
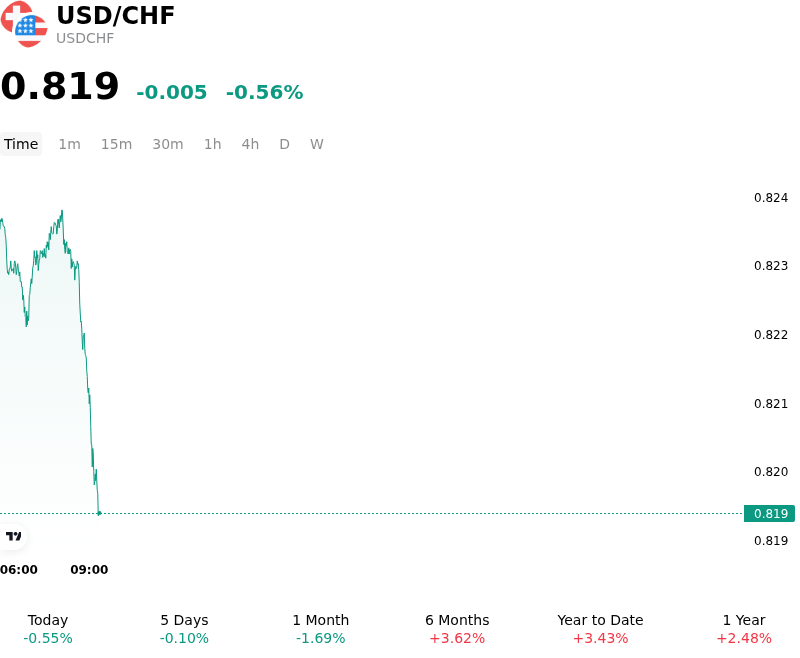
What is driving USD/CHF (USDCHF)’s stock price down today?
The downward pressure on USDCHF primarily reflects a recalibration of U.S. monetary policy expectations following the Federal Reserve's policy decision and the subsequent easing of Treasury yields. As market participants digested the Fed's choice to hold interest rates steady alongside balanced communication regarding the policy outlook, U.S. bond yields pulled back, sapping momentum from the Greenback. The softening in Treasury yields compressed the interest rate differential between the U.S. Dollar and the Swiss Franc, diminishing the structural carry support that had previously favored the U.S. currency.
Concurrently, the Swiss Franc benefited from safe-haven capital flows and shifting risk sentiment. Persistent volatility in broader equity markets and lingering fiscal uncertainties in Europe encouraged institutional investors to direct capital toward low-beta, safe-haven assets. Although the Swiss National Bank maintains an accommodative zero-rate environment due to muted domestic inflation, the Franc's traditional haven characteristics enabled it to attract steady inflows during the session.
From a market positioning perspective, the movement was further amplified by the unwinding of stretched long-Dollar exposures following the central bank meeting. With immediate policy catalysts resolved and U.S. yields consolidating, tactical market participants trimmed U.S. Dollar holdings against low-yielding European currencies. While the wide interest rate differential between the Fed and the Swiss National Bank remains an important medium-term anchor for carry trade strategies, short-term momentum in USDCHF remains dictated by bond yield trajectories and global risk sentiment.
Technical Analysis of USD/CHF (USDCHF)
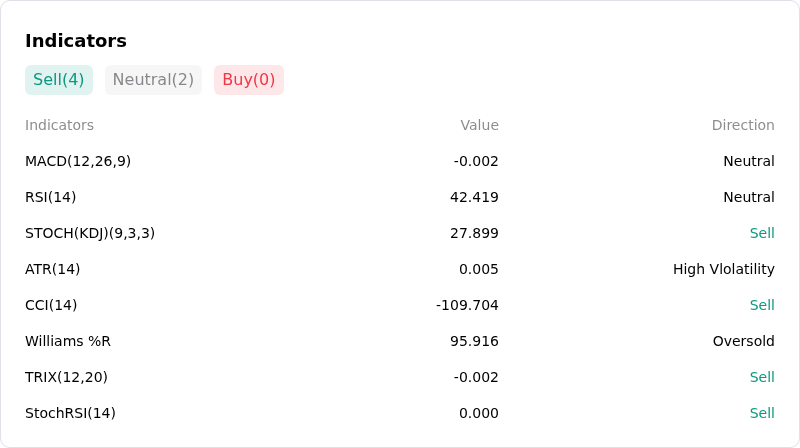
Technically, USD/CHF (USDCHF) shows a MACD (12,26,9) value of -0.002, indicating a neutral signal. The RSI at 42.419 suggests neutral condition and the Williams %R at 95.916 suggests oversold condition. Please monitor closely.
More details about USD/CHF (USDCHF)
Recent Events and Risks:
- Federal Reserve Policy Uncertainty: The Fed's decision to hold interest rates unchanged at 3.75%–4.00% amid dissenting internal votes has muted US Dollar momentum, creating policy ambiguity and leaving USD/CHF vulnerable to downside re-pricing.
- European Fiscal Stress and Safe-Haven CHF Inflows: Escalating sovereign debt concerns in France and broader European fiscal instability have fueled safe-haven demand for the Swiss Franc, dragging Swiss 10-year government bond yields down toward 0.47% and applying downside pressure on USD/CHF.
- Deteriorating Swiss Economic Sentiment: The Swiss ZEW Expectations index plummeted to -15.3 in October from +2.6 in September, marking its sharpest monthly drop since March 2026 and fueling volatility as market participants re-evaluate growth dynamics.
- Carry Trade Unwind and Technical Resistance: With USD/CHF capped near key resistance around 0.8300–0.8320, overbought momentum leaves the pair susceptible to abrupt carry trade unwinds and intraday retracements toward lower support levels.
Nothing in this material constitutes investment advice, personal recommendation, investment research, an offer, or a solicitation to buy or sell any financial instrument. The content has been prepared without consideration of your individual investment objectives, financial situation, or needs, and should not be treated as such.
Past performance is not a reliable indicator of future performance and/or results. Forward-looking scenarios or forecasts are not a guarantee of future performance. Actual results may differ materially from those anticipated.
Mitrade makes no representation or warranty as to the accuracy or completeness of the information provided and accepts no liability for any loss arising from reliance on such information.
Recommended Articles


