



GBP/JPY Price Forecast: Uptrend holds, eyes on 216.00, BoJ risks loom
- GBP/JPY holds uptrend as buyers defend 215.00 support zone.
- Break above 216.00 exposes YTD high at 216.60.
- Drop below 215.00 targets 214.68 and key SMA confluence.
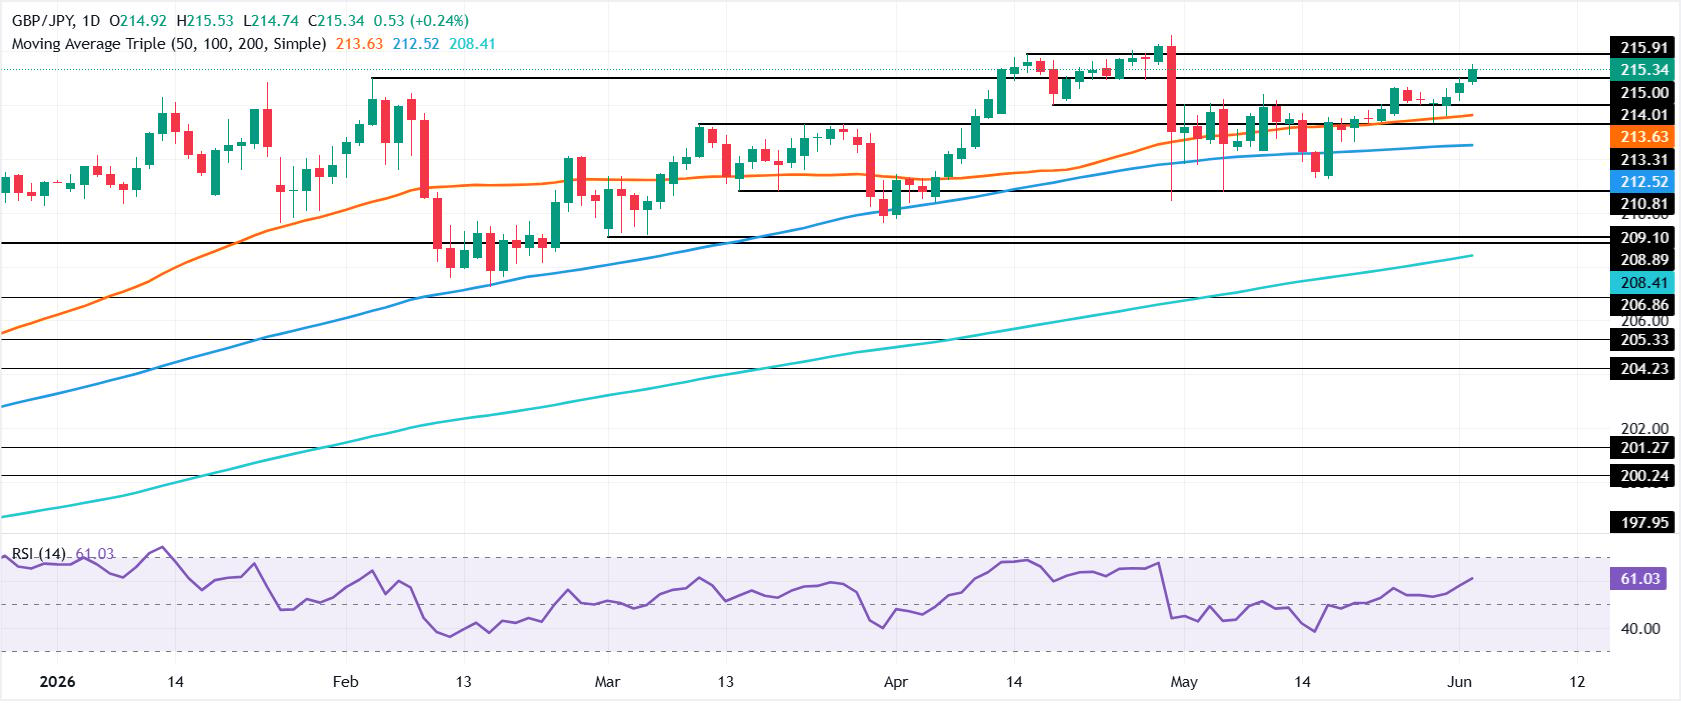
The Pound Sterling advances versus the Japanese Yen on Tuesday, up by 0.24%, driven by traders’ optimism about a US-Iran deal, even though there are rumours that Iran has halted negotiations amid the Israel-Hezbollah conflict over the weekend. The GBP/JPY trades at 215.34 after bouncing off daily lows of 214.74.
GBP/JPY Price Forecast: Technical outlook
From a technical standpoint, the GBP/JPY uptrend remains intact, but as the USD/JPY pair closes into the 160.00 area, the possibility of an intervention by the Bank of Japan (BoJ) increases.
If not for the BoJ, the GBP/JPY could resume its advance and test the 216.00 figure, followed by the yearly peak at 216.60 hit on April 30. A breach of the latter, and there’s nothing in the way for buyers to drive the cross-pair towards the 220.00 mark.
On the flip side, the first support for GBP/JPY is at 215.00. Once hurdled, the next stop would be the May 25 daily high turned support at 214.68, ahead of the confluence of the 20- and 50-day Simple Moving Averages (SMAs), each at 213.76/68, respectively.
GBP/JPY Price Chart – Daily
Japanese Yen Price Today
The table below shows the percentage change of Japanese Yen (JPY) against listed major currencies today. Japanese Yen was the strongest against the Swiss Franc.
| USD | EUR | GBP | JPY | CAD | AUD | NZD | CHF | |
|---|---|---|---|---|---|---|---|---|
| USD | 0.04% | -0.05% | 0.19% | -0.01% | -0.28% | 0.10% | 0.15% | |
| EUR | -0.04% | -0.09% | 0.13% | -0.07% | -0.32% | 0.07% | 0.09% | |
| GBP | 0.05% | 0.09% | 0.22% | 0.02% | -0.19% | 0.18% | 0.15% | |
| JPY | -0.19% | -0.13% | -0.22% | -0.20% | -0.44% | -0.08% | -0.07% | |
| CAD | 0.01% | 0.07% | -0.02% | 0.20% | -0.25% | 0.12% | 0.12% | |
| AUD | 0.28% | 0.32% | 0.19% | 0.44% | 0.25% | 0.36% | 0.36% | |
| NZD | -0.10% | -0.07% | -0.18% | 0.08% | -0.12% | -0.36% | -0.01% | |
| CHF | -0.15% | -0.09% | -0.15% | 0.07% | -0.12% | -0.36% | 0.00% |
The heat map shows percentage changes of major currencies against each other. The base currency is picked from the left column, while the quote currency is picked from the top row. For example, if you pick the Japanese Yen from the left column and move along the horizontal line to the US Dollar, the percentage change displayed in the box will represent JPY (base)/USD (quote).
Nothing in this material constitutes investment advice, personal recommendation, investment research, an offer, or a solicitation to buy or sell any financial instrument. The content has been prepared without consideration of your individual investment objectives, financial situation, or needs, and should not be treated as such.
Past performance is not a reliable indicator of future performance and/or results. Forward-looking scenarios or forecasts are not a guarantee of future performance. Actual results may differ materially from those anticipated.
Mitrade makes no representation or warranty as to the accuracy or completeness of the information provided and accepts no liability for any loss arising from reliance on such information.
Recommended Articles


