



USD/CAD Price Forecast: Bearish pressure builds below 1.4000
- USD/CAD stays under pressure as strong Canadian labour data and higher Oil prices support the Canadian Dollar.
- Technically, USD/CAD extends its bearish structure of lower highs and lower lows below the 50-day SMA.
- RSI approaches oversold territory, while the MACD stays below the signal line.
USD/CAD trades on the back foot on Monday even as the US Dollar (USD) regains some ground after weakening last week following softer-than-expected US Nonfarm Payrolls (NFP) data. Attention now turns to Wednesday’s US Consumer Price Index (CPI) report. At the time of writing, the pair trades around 1.3932, near its lowest level in two months.
The Canadian Dollar (CAD) draws support from stronger-than-expected domestic labour data and rising Oil prices. West Texas Intermediate (WTI) trades around $80.37 per barrel, up 5.20% on the day.
USD/CAD dip below 1.40 puts focus on US CPI and Fed pricing
According to TD Securities, the latest payrolls data “broke USD/CAD below 1.40,” as the sharp reaction to the contrasting US and Canadian labour market outcomes underscored that “the market remains focused on both central-bank divergence and Canada's domestic outlook.” On the Canadian side, the bank notes that “recent developments in the Canadian economy have evolved broadly in line with our forecasts,” and that while the data surprise is “briefly pushing USD/CAD below the 1.40 support level,” they “think the bearish USD momentum may not sustain unless US CPI also surprises lower to allow market to price out near-term Fed rate hiking odds.”
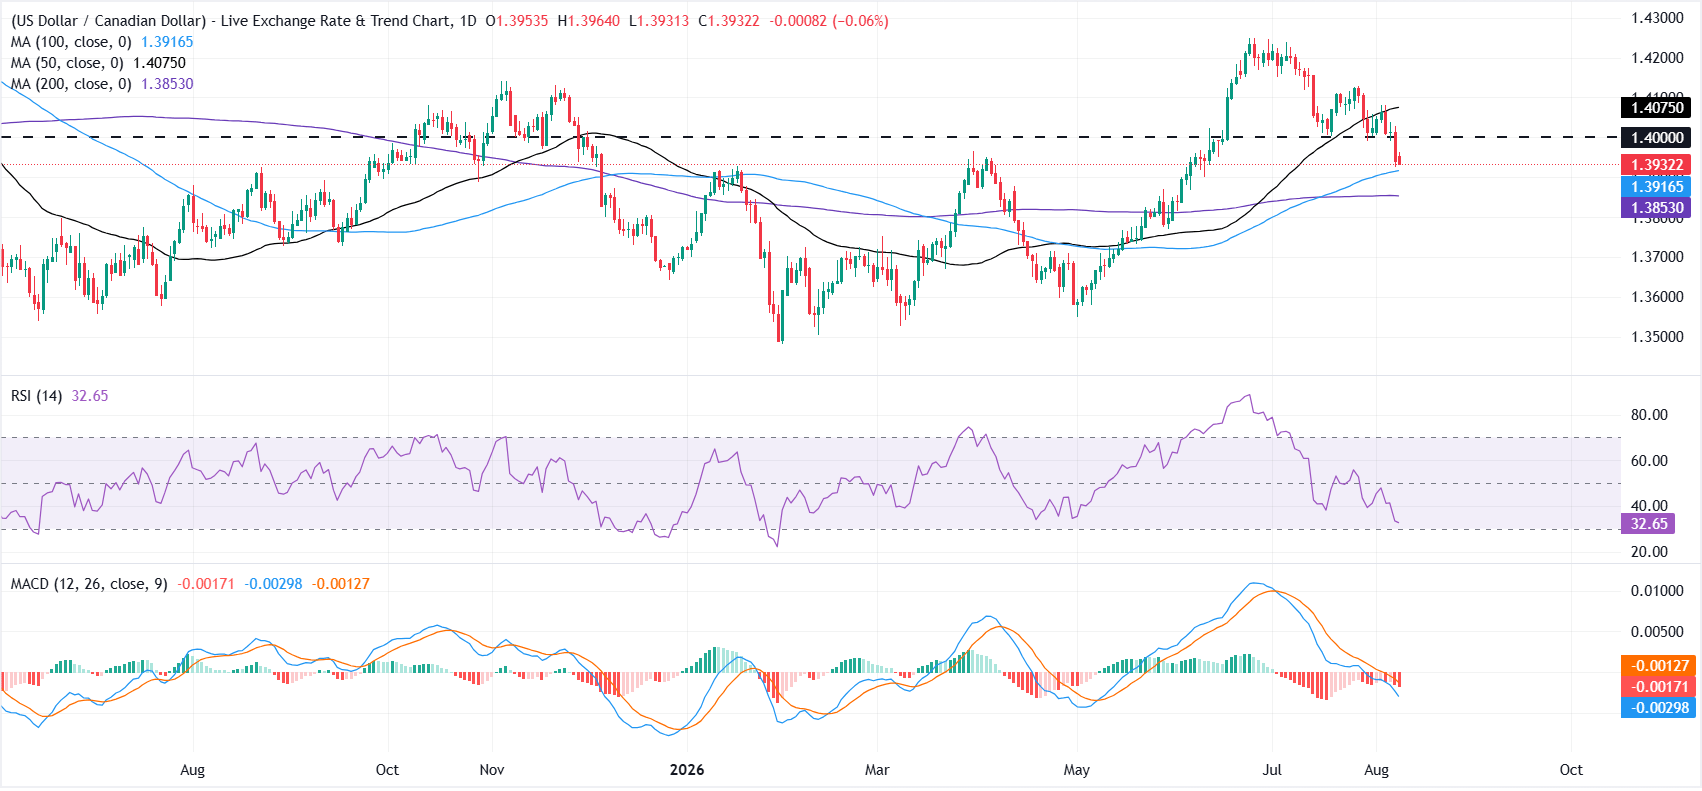
From a technical perspective, USD/CAD has formed a series of lower highs and lower lows since briefly rising above 1.4200 in late June. The pair holds below the 1.4000 psychological mark and the 50-day Simple Moving Average (SMA) at 1.4075, keeping the near-term bias tilted to the downside.
Momentum indicators also favour sellers. The Relative Strength Index (RSI) sits near 33, approaching oversold territory, while the Moving Average Convergence Divergence (MACD) indicator stays in negative territory.
On the downside, the 100-day SMA near 1.3916 offers initial support, followed by the 200-day SMA around 1.3853. A decisive break below the latter could open the door to a deeper decline.
On the topside, the 1.4000 psychological mark acts as immediate resistance, followed by the 50-day SMA at 1.4075. A recovery above this moving average would ease the bearish pressure.
(The technical analysis of this story was written with the help of an AI tool. Know more.)
Canadian Dollar Price Today
The table below shows the percentage change of Canadian Dollar (CAD) against listed major currencies today. Canadian Dollar was the strongest against the Japanese Yen.
| USD | EUR | GBP | JPY | CAD | AUD | NZD | CHF | |
|---|---|---|---|---|---|---|---|---|
| USD | 0.10% | -0.24% | 0.72% | -0.06% | 0.05% | 0.10% | 0.20% | |
| EUR | -0.10% | -0.33% | 0.61% | -0.17% | -0.04% | -0.00% | 0.10% | |
| GBP | 0.24% | 0.33% | 0.97% | 0.17% | 0.31% | 0.33% | 0.44% | |
| JPY | -0.72% | -0.61% | -0.97% | -0.80% | -0.69% | -0.68% | -0.52% | |
| CAD | 0.06% | 0.17% | -0.17% | 0.80% | 0.06% | 0.18% | 0.25% | |
| AUD | -0.05% | 0.04% | -0.31% | 0.69% | -0.06% | 0.02% | 0.15% | |
| NZD | -0.10% | 0.00% | -0.33% | 0.68% | -0.18% | -0.02% | 0.11% | |
| CHF | -0.20% | -0.10% | -0.44% | 0.52% | -0.25% | -0.15% | -0.11% |
The heat map shows percentage changes of major currencies against each other. The base currency is picked from the left column, while the quote currency is picked from the top row. For example, if you pick the Canadian Dollar from the left column and move along the horizontal line to the US Dollar, the percentage change displayed in the box will represent CAD (base)/USD (quote).
Nothing in this material constitutes investment advice, personal recommendation, investment research, an offer, or a solicitation to buy or sell any financial instrument. The content has been prepared without consideration of your individual investment objectives, financial situation, or needs, and should not be treated as such.
Past performance is not a reliable indicator of future performance and/or results. Forward-looking scenarios or forecasts are not a guarantee of future performance. Actual results may differ materially from those anticipated.
Mitrade makes no representation or warranty as to the accuracy or completeness of the information provided and accepts no liability for any loss arising from reliance on such information.
Recommended Articles


