



GBP/JPY Price Forecast: Bulls reclaim 50-day SMA, eye 213.00
- GBP/JPY breaks above 50-day SMA at 210.77, reinforcing bullish momentum.
- Five consecutive higher daily highs signal strengthening buying pressure.
- Break above 211.00 exposes 211.99 and 200-day SMA at 212.92.
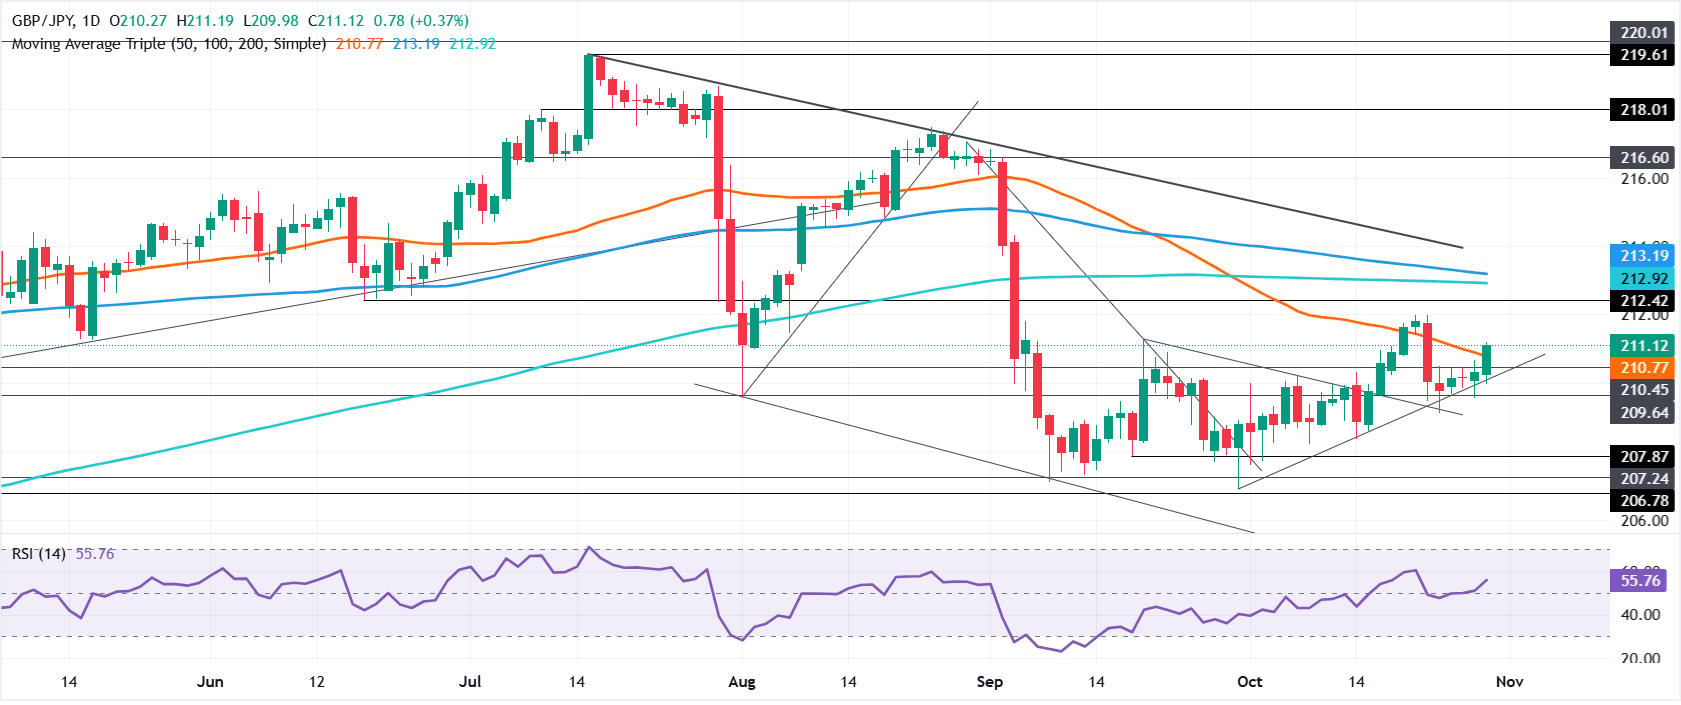
The Pound Sterling rises by over 0.32% against the Japanese Yen as the pair clears the 50-day Simple Moving Average (SMA) of 210.77, putting in play a chance of testing the 211.00 psychological figure.
GBP/JPY Price Forecast: Technical outlook
At the time of writing, GBP/JPY is closing in on 211.00, following three days of muted price action. Worth noting that the cross-pair cleared to fresh highs in each of the last five days, an indication that buyers are gaining momentum. The Relative Strength Index (RSI) drifts higher, an indication that buyers are in charge.
If GBP/JPY extends its gains above 211.00, the next stop is the October 22 high of 211.99. Above the next area of interest is the 200-day SMA at 212.92, followed by the 100-day SMA at 213.19.
For a bearish reversal, sellers will look for a break below the October 28 swing low of 209.57. This opens the path towards 208.01, the September 25 daily low.
GBP/JPY Price Chart – Daily
Japanese Yen FAQs
The Japanese Yen (JPY) is one of the world’s most traded currencies. Its value is broadly determined by the performance of the Japanese economy, but more specifically by the Bank of Japan’s policy, the differential between Japanese and US bond yields, or risk sentiment among traders, among other factors.
One of the Bank of Japan’s mandates is currency control, so its moves are key for the Yen. The BoJ has directly intervened in currency markets sometimes, generally to lower the value of the Yen, although it refrains from doing it often due to political concerns of its main trading partners. The BoJ ultra-loose monetary policy between 2013 and 2024 caused the Yen to depreciate against its main currency peers due to an increasing policy divergence between the Bank of Japan and other main central banks. More recently, the gradually unwinding of this ultra-loose policy has given some support to the Yen.
Over the last decade, the BoJ’s stance of sticking to ultra-loose monetary policy has led to a widening policy divergence with other central banks, particularly with the US Federal Reserve. This supported a widening of the differential between the 10-year US and Japanese bonds, which favored the US Dollar against the Japanese Yen. The BoJ decision in 2024 to gradually abandon the ultra-loose policy, coupled with interest-rate cuts in other major central banks, is narrowing this differential.
The Japanese Yen is often seen as a safe-haven investment. This means that in times of market stress, investors are more likely to put their money in the Japanese currency due to its supposed reliability and stability. Turbulent times are likely to strengthen the Yen’s value against other currencies seen as more risky to invest in.
Nothing in this material constitutes investment advice, personal recommendation, investment research, an offer, or a solicitation to buy or sell any financial instrument. The content has been prepared without consideration of your individual investment objectives, financial situation, or needs, and should not be treated as such.
Past performance is not a reliable indicator of future performance and/or results. Forward-looking scenarios or forecasts are not a guarantee of future performance. Actual results may differ materially from those anticipated.
Mitrade makes no representation or warranty as to the accuracy or completeness of the information provided and accepts no liability for any loss arising from reliance on such information.
Recommended Articles


