



Silver Price Forecast: XAG/USD consolidates below 100-Day SMA as momentum fades
- Silver trades in a narrow range on Monday following Friday's sharp 4.11% drop.
- Technically, XAG/USD has slipped below its 100-day SMA, tilting the near-term bias bearish.
- The RSI at 53 has eased from above 60, signaling fading bullish momentum, while the MACD flattens near the zero line.
Silver (XAG/USD) is little changed on Monday, caught between a weaker US Dollar (USD) and lingering hawkish Federal Reserve (Fed) expectations, leaving the metal without clear direction after tumbling 4.11% on Friday in the wake of Fed Chair Kevin Warsh's hawkish Jackson Hole comments. At the time of writing, XAG/USD trades around $66.25, down 0.23% on the day.
Warsh's inflation-focused remarks at Jackson Hole initially pushed the US Dollar to over one-week highs, with the Dollar Index (DXY) climbing as high as 99.72, as traders revived bets on a September rate hike. The CME FedWatch Tool now shows a 65% probability of a 25-basis-point increase at next month's meeting. The Greenback has since retraced most of those gains on Monday, with the DXY trading around 99.44 at the time of writing.
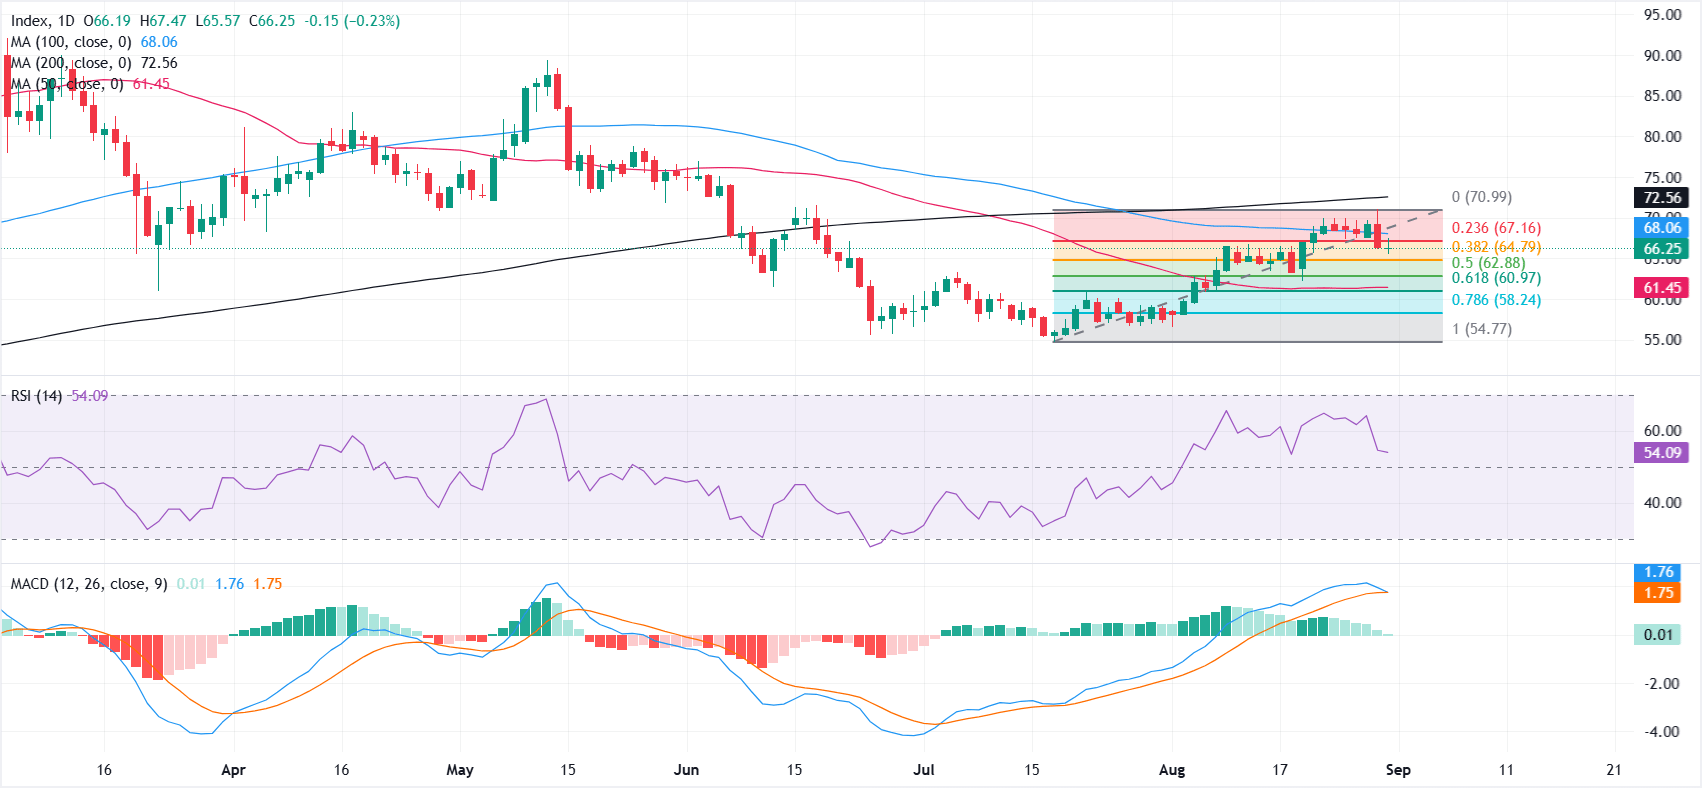
From a technical perspective, the latest leg lower has pushed XAG/USD back below the 100-day Simple Moving Average (SMA), tilting the near-term bias to bearish, though the metal still holds above the 50-day SMA at $61 and a Fibonacci support band between $60.97 (61.8% retracement) and $64.79 (38.2% level).
The Relative Strength Index (RSI) on the daily chart at 53 remains in neutral territory, having eased from above 60, suggesting bullish momentum is starting to fade while the Moving Average Convergence Divergence (MACD) indicator hovers near the zero line with a flattened profile, hinting at a consolidative phase before the next directional move.
On the topside, initial resistance emerges at the 23.6% Fibonacci retracement at $67.16, followed closely by the 100-day SMA near $68, where a sustained break would open the way toward the Fibonacci structural anchor at $70.99 and ultimately the 200-day SMA at $72.
On the downside, immediate support is seen at the 38.2% retracement at $64.79, with deeper demand located at the 50% level at $62.88 and the 61.8% retracement at $60.97, while the 50-day SMA at $61 reinforces this broader demand zone on any extended pullback.
(The technical analysis of this story was written with the help of an AI tool. Know more.)
US Dollar Price Today
The table below shows the percentage change of US Dollar (USD) against listed major currencies today. US Dollar was the strongest against the Australian Dollar.
| USD | EUR | GBP | JPY | CAD | AUD | NZD | CHF | |
|---|---|---|---|---|---|---|---|---|
| USD | -0.29% | -0.10% | -0.24% | -0.35% | -0.01% | -0.09% | -0.18% | |
| EUR | 0.29% | 0.18% | 0.06% | -0.03% | 0.23% | 0.22% | 0.11% | |
| GBP | 0.10% | -0.18% | -0.11% | -0.24% | 0.05% | 0.03% | -0.04% | |
| JPY | 0.24% | -0.06% | 0.11% | -0.12% | 0.22% | 0.17% | 0.08% | |
| CAD | 0.35% | 0.03% | 0.24% | 0.12% | 0.35% | 0.29% | 0.19% | |
| AUD | 0.01% | -0.23% | -0.05% | -0.22% | -0.35% | -0.04% | -0.09% | |
| NZD | 0.09% | -0.22% | -0.03% | -0.17% | -0.29% | 0.04% | -0.08% | |
| CHF | 0.18% | -0.11% | 0.04% | -0.08% | -0.19% | 0.09% | 0.08% |
The heat map shows percentage changes of major currencies against each other. The base currency is picked from the left column, while the quote currency is picked from the top row. For example, if you pick the US Dollar from the left column and move along the horizontal line to the Japanese Yen, the percentage change displayed in the box will represent USD (base)/JPY (quote).
Nothing in this material constitutes investment advice, personal recommendation, investment research, an offer, or a solicitation to buy or sell any financial instrument. The content has been prepared without consideration of your individual investment objectives, financial situation, or needs, and should not be treated as such.
Past performance is not a reliable indicator of future performance and/or results. Forward-looking scenarios or forecasts are not a guarantee of future performance. Actual results may differ materially from those anticipated.
Mitrade makes no representation or warranty as to the accuracy or completeness of the information provided and accepts no liability for any loss arising from reliance on such information.
Recommended Articles


