



Gold slides on US yields surge ahead of CPI
- Gold declines 0.37% as ten-year Treasury yields climb to 5.223%.
- WTI tops $94 as Middle East tensions reinforce inflation concerns.
- US CPI takes center stage as October Fed hike odds reach 23%.
Gold price (XAU/USD) extends its losses on Tuesday as US Treasury yields resumed their uptrend, erasing previous losses, even though the US Dollar faces headwinds ahead of the release of US inflation data. At the time of writing, XAU/USD trades at $4,157, down 0.37%.
XAU/USD slides toward $4,150 as rising Treasury yields overpower Dollar weakness
US data released earlier showed that the ADP Employment Change 4-week average dipped from 25.25K to 24.75K, a moderation in the labor market, which some Federal Reserve (Fed) officials recognized as stable. Existing Home Sales Change for September improved and grew 1.5% MoM, exceeding August’s -3.2% contraction as home sales rose from 3.93 million to 3.99 million.
Despite the data, bullion prices are losing steam, as US Treasury yields began the session on a lower note but have recently risen. The US 10-year Treasury yield is up 6 basis points to 5.223%, as energy prices continue to rise.
The US Dollar Index (DXY), which tracks the performance of the Greenback against six currencies, dives by over 0.32% to 102.24 as its positive correlation with Oil prices breaks.
West Texas Intermediate (WTI) is supported by tensions in the Middle East and is up more than 1% to $94.20.
The US-Iran conflict seems far from a swift resolution, as Tehran escalated its attacks on vessels transiting the Strait of Hormuz. Recent reports noted that traffic is near 80% of pre-war levels, an indication that crude and energy markets are stabilizing.
US President Donald Trump said the Houthis are behaving “very badly” and that he will make a decision on Iran very soon. He praised the US Navy blockade against Iran, and added that he is working with Russia and Ukraine to end the war.
Aside from this, Chicago Fed President Austan Goolsbee said that the jobs market is very stable, growth has been solid, and that “If inflation remains persistent, then I think it’s clear what the Fed has to do.”
Fed Governor Christopher Waller said AI investment is affecting US yields, could help the Fed manage demand, and inflation expectations remain well anchored.
Money markets have priced in a 23% chance of a 25 basis points rate hike by the Fed at the October 27-28 meeting, according to Prime Terminal.
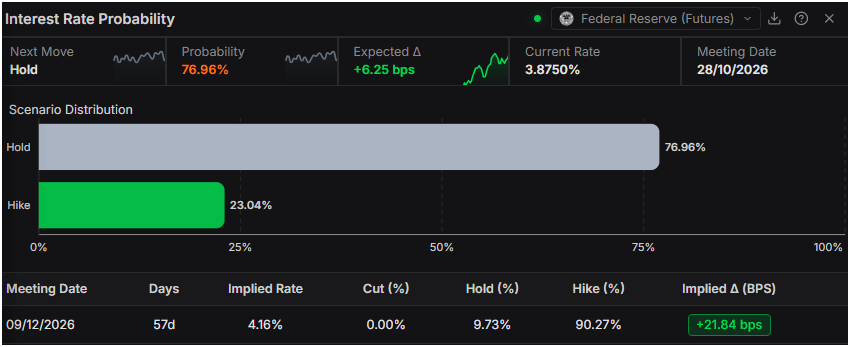
Investors are focused on Wednesday’s Consumer Price Index release, while Thursday's Producer Price Index figures and remarks from Fed Chair Kevin Warsh will be closely scrutinized.
XAU/USD technical analysis: Gold’s bearish bias remains intact
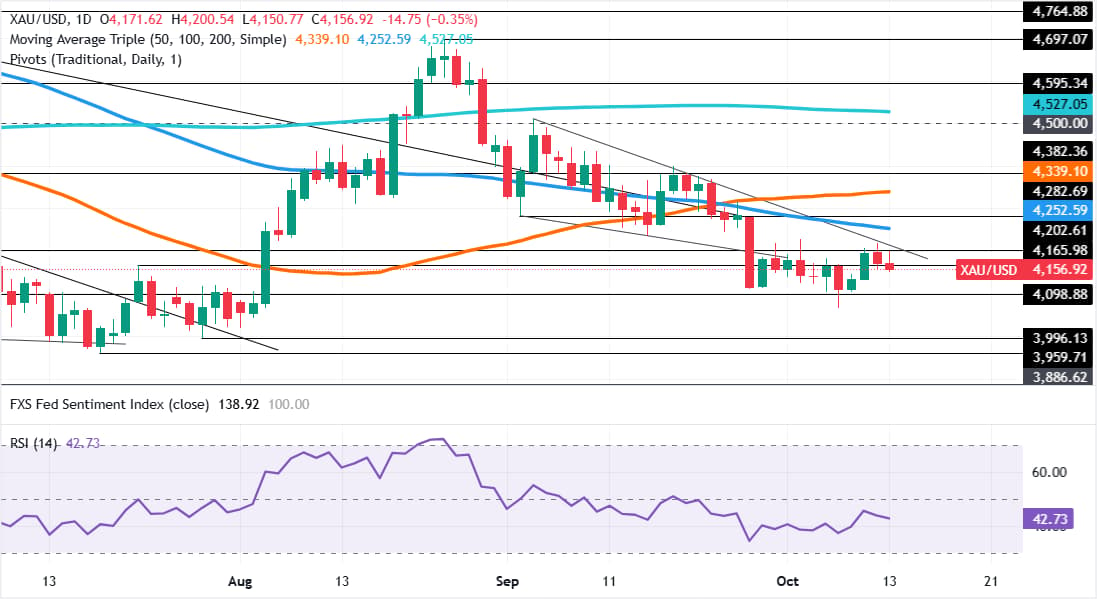
Gold price is still unable to decisively clear $4,200, with buyers making their second attempt this week, but they were quickly rejected, and the yellow metal fell to a fresh weekly low of $4,150, which could open the door to further downside.
Momentum continues to favor sellers as the Relative Strength Index (RSI) is below its 50-neutral level and aiming lower.
That said, the XAU/USD first support is the weekly low, ahead of $4,100. A breach of the latter would expose the psychological $4,050 area ahead of the July 29 cycle low of $3,996, and $4,000 below.
For a bullish reversal, Gold must decisively clear $4,200. Once hurdled, a move to the 100-day Simple Moving Average (SMA) at $4,252 is on the cards. Above is the 50-day SMA at $4,339, followed by $4,500. The next stop is the 200-day SMA at $4,522.
Gold FAQs
Gold has played a key role in human’s history as it has been widely used as a store of value and medium of exchange. Currently, apart from its shine and usage for jewelry, the precious metal is widely seen as a safe-haven asset, meaning that it is considered a good investment during turbulent times. Gold is also widely seen as a hedge against inflation and against depreciating currencies as it doesn’t rely on any specific issuer or government.
Central banks are the biggest Gold holders. In their aim to support their currencies in turbulent times, central banks tend to diversify their reserves and buy Gold to improve the perceived strength of the economy and the currency. High Gold reserves can be a source of trust for a country’s solvency. Central banks added 1,136 tonnes of Gold worth around $70 billion to their reserves in 2022, according to data from the World Gold Council. This is the highest yearly purchase since records began. Central banks from emerging economies such as China, India and Turkey are quickly increasing their Gold reserves.
Gold has an inverse correlation with the US Dollar and US Treasuries, which are both major reserve and safe-haven assets. When the Dollar depreciates, Gold tends to rise, enabling investors and central banks to diversify their assets in turbulent times. Gold is also inversely correlated with risk assets. A rally in the stock market tends to weaken Gold price, while sell-offs in riskier markets tend to favor the precious metal.
The price can move due to a wide range of factors. Geopolitical instability or fears of a deep recession can quickly make Gold price escalate due to its safe-haven status. As a yield-less asset, Gold tends to rise with lower interest rates, while higher cost of money usually weighs down on the yellow metal. Still, most moves depend on how the US Dollar (USD) behaves as the asset is priced in dollars (XAU/USD). A strong Dollar tends to keep the price of Gold controlled, whereas a weaker Dollar is likely to push Gold prices up.
Nothing in this material constitutes investment advice, personal recommendation, investment research, an offer, or a solicitation to buy or sell any financial instrument. The content has been prepared without consideration of your individual investment objectives, financial situation, or needs, and should not be treated as such.
Past performance is not a reliable indicator of future performance and/or results. Forward-looking scenarios or forecasts are not a guarantee of future performance. Actual results may differ materially from those anticipated.
Mitrade makes no representation or warranty as to the accuracy or completeness of the information provided and accepts no liability for any loss arising from reliance on such information.
Recommended Articles


