



Gold rebounds as global equity sell-off weigh on Treasury yields
- Gold recovers as falling US Treasury yields and a softer US Dollar attract buyers.
- Hawkish Fed expectations remain a challenge for Gold as inflation risks persist.
- XAU/USD remains below the Bollinger Bands midline, keeping the near-term technical outlook bearish.
Gold (XAU/USD) attracts fresh buying on Thursday as weakness across global equities, driven by mounting concerns over AI-related investments, triggers a sharp pullback in US Treasury yields and drags the US Dollar (USD) lower from fresh year-to-date highs. At the time of writing, XAU/USD trades around $4,155, up 1.30% on the day.
The risk-averse mood drives investors toward safe-haven assets, including precious metals and government bonds. The benchmark 10-year US Treasury yield falls around 7 basis points (bps) to 5.08%, its lowest level in three weeks. Meanwhile, the US Dollar Index (DXY), which tracks the Greenback’s value against a basket of six major currencies, slips toward 102.00 after reaching 102.94 the previous day.
Nevertheless, the fundamental backdrop remains challenging for Gold, as hawkish Federal Reserve (Fed) expectations could prevent a deeper decline in the US Dollar and Treasury yields. Wednesday’s hotter-than-expected US Consumer Price Index (CPI) report strengthened the case for additional interest rate hikes. Higher borrowing costs increase the opportunity cost of holding the non-yielding metal.
Analysts at Commerzbank highlight that September US inflation data came in hotter than expected, with "headline CPI came in at 3.7% yoy, the fastest pace of increase in five months." They note that on a monthly basis, headline CPI "rose 0.6% mom, driven by a surge in fuel costs, while core CPI rose 0.3% mom."
According to the bank, the stronger print "immediately revived bets on further Fed tightening, with traders pricing in additional rate hikes later this year and into 2027." Commerzbank adds that "the Fed funds futures are pricing in 32% chance of a 25bp hike in October" and are "pricing in a total hike of 29bp by end-2026 and 75bp by end-2027."
However, a rate hike at the October meeting remains less likely than a hold, as recent Fed communication suggests policymakers are cautious about delivering back-to-back increases. San Francisco Fed President Mary Daly said “more rate hikes likely, timing still under consideration,” adding that “risks to above-target inflation remain high” and a “steady labor market allows focus on price stability.” New York Fed President John Williams and Fed Vice Chair Philip Jefferson also signalled earlier this month that officials could take time before raising rates again.
Attention now shifts to US Producer Price Index (PPI), Retail Sales and weekly Initial Jobless Claims data, due during American trading hours, for fresh clues on the Fed’s monetary policy path.
Technical analysis: XAU/USD needs a break above $4,200 to extend recovery
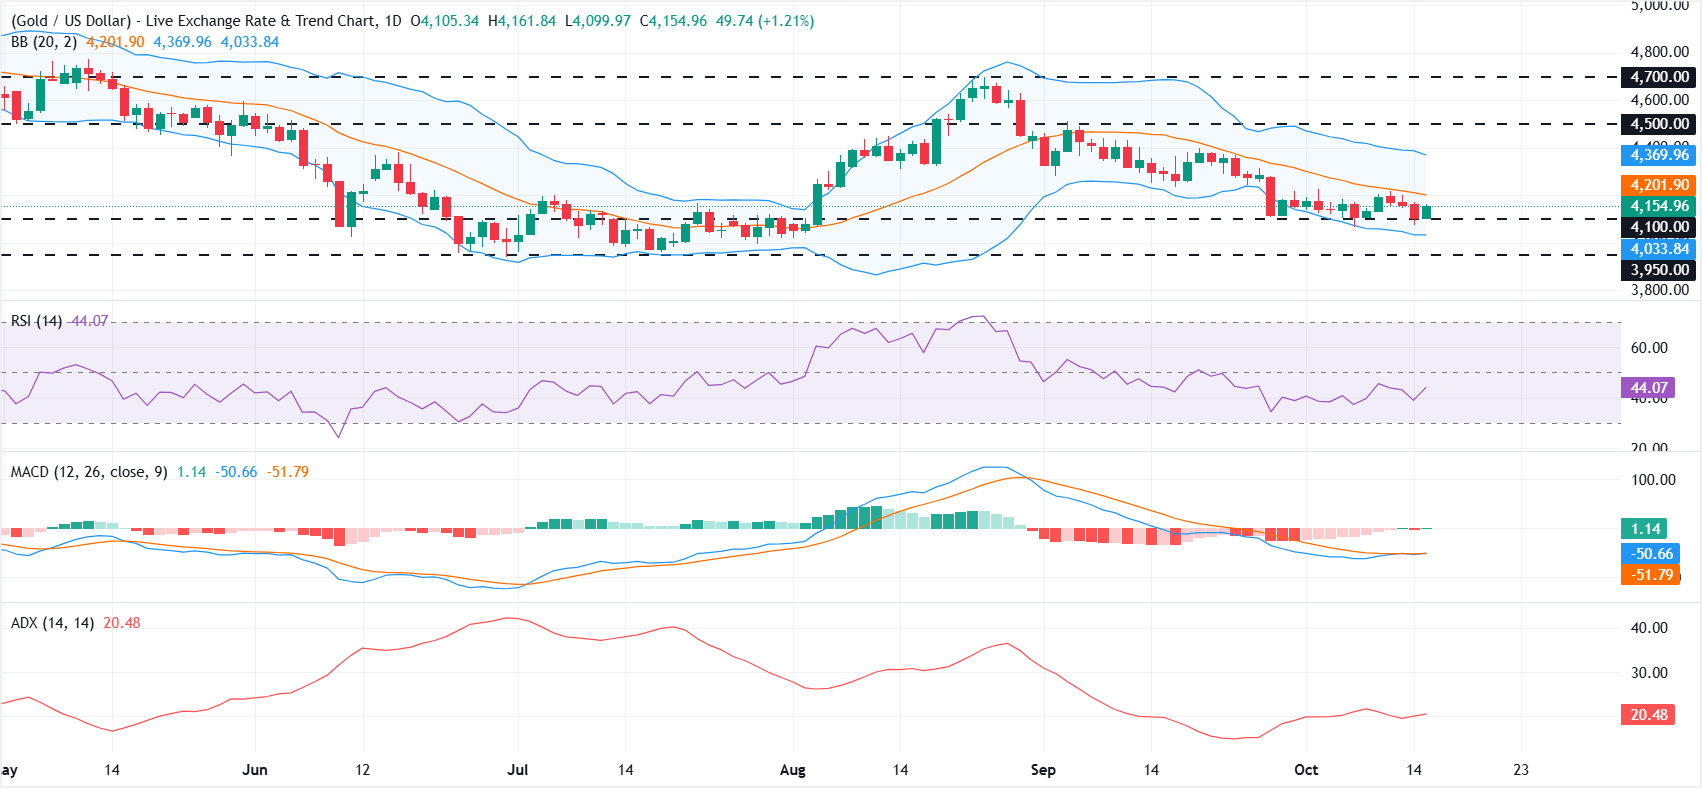
On the daily chart, XAU/USD maintains a pattern of lower highs and lower lows since peaking near $4,700 in late August, although prices remain largely trapped between $4,100 and $4,200 since the start of the month. The metal holds below the 20-day Simple Moving Average (SMA), which forms the Bollinger middle band around $4,201.81, keeping the near-term bias tilted to the downside.
The Relative Strength Index (14) near 43.9 leans slightly negative without signalling oversold conditions. The Moving Average Convergence Divergence (MACD) has turned marginally positive, suggesting fading downside momentum rather than a clear bullish reversal, while the Average Directional Index (14) near 20 points to a relatively weak underlying trend.
On the downside, initial support emerges near $4,100, followed by the lower Bollinger band around $4,033.64. A break below this level would expose the $4,000-$3,950 support zone.
On the topside, a first hurdle is seen at the Bollinger middle band at $4,201, with subsequent resistance aligning at the upper band near $4,369 and then the more strategic horizontal caps at $4,500 and $4,700, which would need to be reclaimed to ease the broader bearish pressure.
Gold FAQs
Gold has played a key role in human’s history as it has been widely used as a store of value and medium of exchange. Currently, apart from its shine and usage for jewelry, the precious metal is widely seen as a safe-haven asset, meaning that it is considered a good investment during turbulent times. Gold is also widely seen as a hedge against inflation and against depreciating currencies as it doesn’t rely on any specific issuer or government.
Central banks are the biggest Gold holders. In their aim to support their currencies in turbulent times, central banks tend to diversify their reserves and buy Gold to improve the perceived strength of the economy and the currency. High Gold reserves can be a source of trust for a country’s solvency. Central banks added 1,136 tonnes of Gold worth around $70 billion to their reserves in 2022, according to data from the World Gold Council. This is the highest yearly purchase since records began. Central banks from emerging economies such as China, India and Turkey are quickly increasing their Gold reserves.
Gold has an inverse correlation with the US Dollar and US Treasuries, which are both major reserve and safe-haven assets. When the Dollar depreciates, Gold tends to rise, enabling investors and central banks to diversify their assets in turbulent times. Gold is also inversely correlated with risk assets. A rally in the stock market tends to weaken Gold price, while sell-offs in riskier markets tend to favor the precious metal.
The price can move due to a wide range of factors. Geopolitical instability or fears of a deep recession can quickly make Gold price escalate due to its safe-haven status. As a yield-less asset, Gold tends to rise with lower interest rates, while higher cost of money usually weighs down on the yellow metal. Still, most moves depend on how the US Dollar (USD) behaves as the asset is priced in dollars (XAU/USD). A strong Dollar tends to keep the price of Gold controlled, whereas a weaker Dollar is likely to push Gold prices up.
Nothing in this material constitutes investment advice, personal recommendation, investment research, an offer, or a solicitation to buy or sell any financial instrument. The content has been prepared without consideration of your individual investment objectives, financial situation, or needs, and should not be treated as such.
Past performance is not a reliable indicator of future performance and/or results. Forward-looking scenarios or forecasts are not a guarantee of future performance. Actual results may differ materially from those anticipated.
Mitrade makes no representation or warranty as to the accuracy or completeness of the information provided and accepts no liability for any loss arising from reliance on such information.
Recommended Articles


