



CoreWeave Stock Forecast: $104 Billion Backlog Faces AI Debt Stress
TradingKey - CoreWeave (NASDAQ: CRWV) closed October 14 at $65.78, -15.46% to the downside, after reaching an intraday low of $64.41. Stress in the bond market is causing concern regarding CoreWeave’s ability to fund its infrastructure buildout.
My near-term outlook remains bearish despite the very strong customer demand. CoreWeave is contracting to provide cloud compute services. The key test is whether the contracted compute services can convert to cash quick enough to service debt, pay leases, and purchase new compute hardware.
Bond Yields Near 15% Put Financing in Focus
CoreWeave’s longer-dated unsecured bonds yielded around 15% by October 14, way above their original coupons. Reuters reported on October 15 that credit-default-swap spreads for CoreWeave exceeded 1,000 basis points.
As of June 30, the company reported approximately $35.6 billion in debt and $16.3 billion in operating-lease obligations, totaling $51.9 billion. Rising bond yields will not reset interest on CoreWeave’s existing fixed-rate debt, but could make financing more expensive in the future.
$104 Billion Backlog Still Shows Strong Demand
Revenue backlog was approximately $104 billion in Q2, a approximately $4.8 billion increase from Q1, and excluded more than $25 billion in new customer commitments early in Q3. Backlog represents potential future revenue, and therefore, revenue after fulfillment of the service, subject to customer payment. Backlog does not reflect cash currently available to make debt service payments.
In September, CoreWeave reported that customers signed three-to-six-month contracts for compute services at around $40 million per megawatt on an annualized basis. In August, contracted power was 4.2 GW, compared to 3.7 GW in June.
Q2 Revenue Doubled, but Net Loss Deepened
In the second quarter, revenue grew 112% to $2.58 billion and adjusted EBITDA more than doubled to $1.51 billion, or a 59% margin. Despite the revenue and adjusted EBITDA growth, the net loss deepened to $626 million from $290 million.
Adjusted EBITDA excludes interest, depreciation and capex. Strong EBITDA margins do not establish positive free cash flow, and funding costs, rather than AI demand, could determine whether the company creates equity value.
2026 Capex Guidance Reaches $39 Billion
Management increased its expected 2026 capital spending to $35-39 billion, including expected spending of $11.5-13.5 billion in Q3. Management also provided revenue guidance of $3.45-3.60 billion for the quarter and interest expense guidance of $860-940 million.
Full year revenue guidance is $12.4-13.2 billion. The Company expects an “annualized run rate” of revenue of $18.5-19.5 billion at the end of the year, based on one month’s sales multiplied by 12, not total yearly recognized revenue. The primary risk to the valuation remains the funding required to achieve the targets.
Microsoft, Meta and OpenAI Add Concentration Risk
CoreWeave has a $21 billion expanded agreement with Meta announced in April 2026. A September 2025 OpenAI expansion worth up to $6.5 billion brought announced OpenAI contracts to approximately $22.4 billion at that time.
CoreWeave had three customers that accounted for 72% of Q2 revenue. Although these customer relationships provide demand visibility, concentration risk increases with large customers.
Nvidia Access Is an Edge and a Dependency
According to CoreWeave, all GPUs in its infrastructure are Nvidia GPUs, per customer requests. It also announced the first bring-up and validation of Nvidia’s Vera Rubin NVL72 system.
Early access to challenging workloads is important, but relying on a single vendor creates supply chain risk. Rising costs, frequent upgrades and short product life cycles pose challenges. Broad deployment and strong profitability are not guaranteed by a product validation.
Next Catalyst: Q3 Funding and Cash Flow
No Q3 earnings date was shown on CoreWeave’s investor-events page as of October 15. CEO Michael Intrator defended the company’s backlog in an October 14 employee memo as part of the selloff.
I will evaluate interest expense, new debt terms, capex, and liquidity. I will also look at free cash flow, backlog conversion and cash conversion. Shareholder risks increase if constructing and funding costly projects take longer. Transforming backlog into cash at cheaper cost of capital is key.
CoreWeave Technical Analysis: $60.57 Is the Next Test
CoreWeave sunk 15.46% on 10/14, closing at $65.78 after touching an intraday low of $64.41. This sealed the break beneath support at $70.59, and allowed it to act as resistance. The supplied chart places price below the 50 & 200 SMA, suggesting a down trend, but these averages are unverified.
RSI is shown near 29, below a signal line of 47, on the supplied chart. These readings, along with the falling trendline, are not verified. RSI does indicate oversold conditions, and possibly a short term bounce. However, it does not validate if buyers are in control.
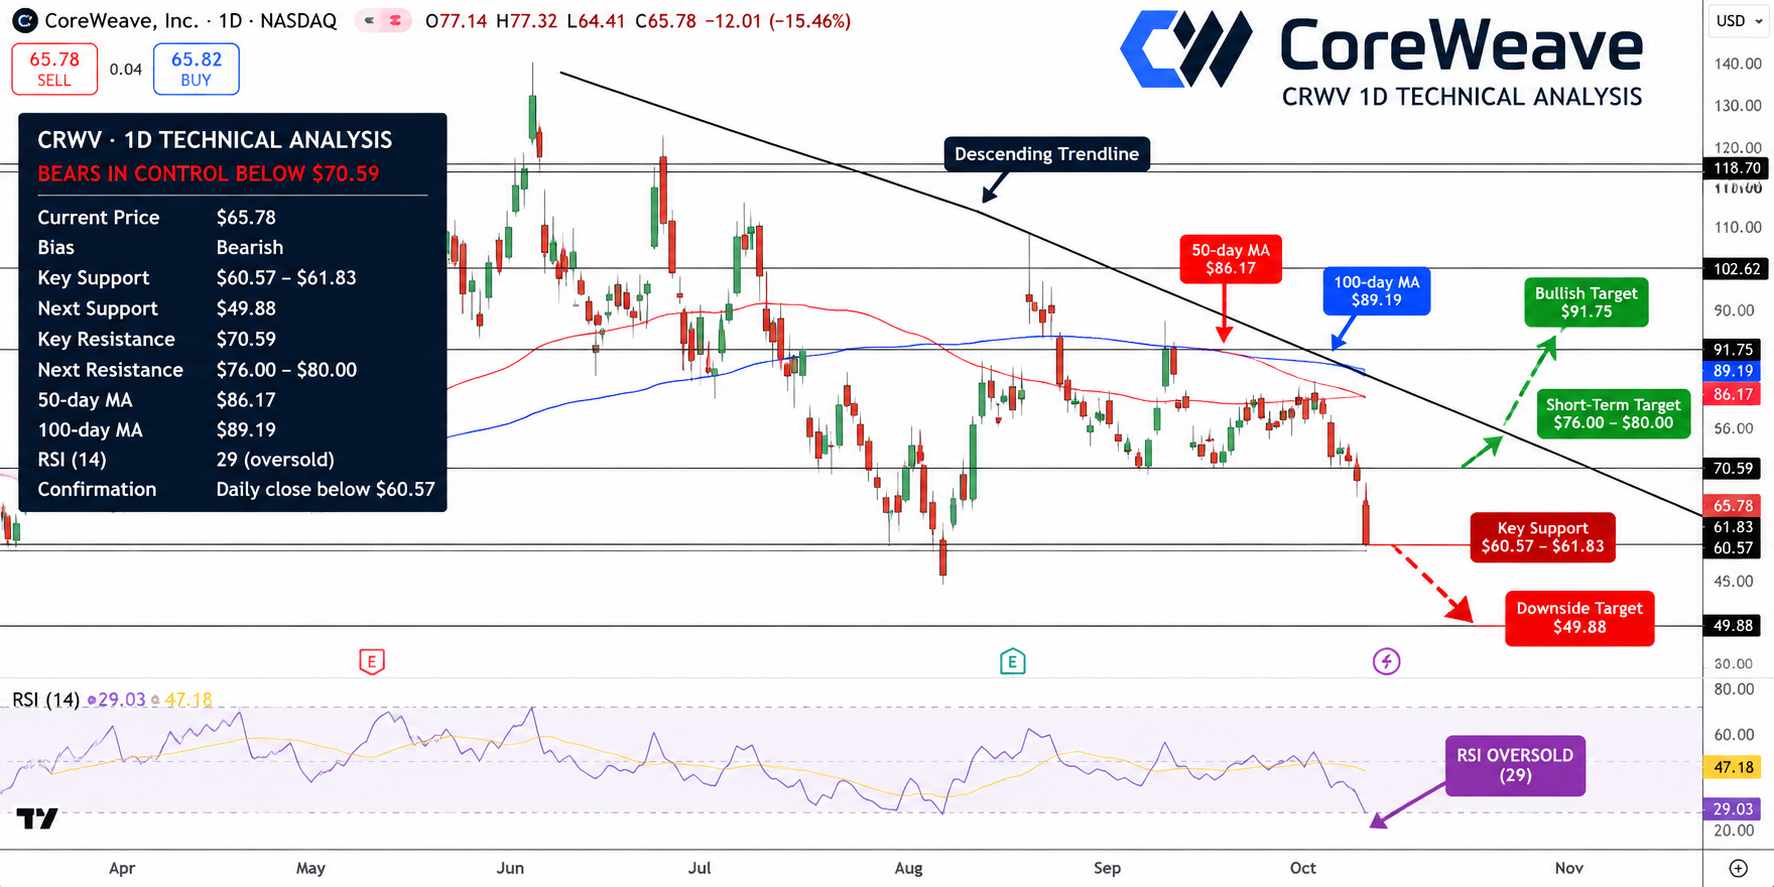
CoreWeave Price Chart - Source: Tradingview
With this in mind, and until $70.59 is recaptured, the trend will likely remain down. $61.83 - $60.57 is support, and a breakdown of $60.57 would open up $49.88. A rebound could retest resistance around $76-80, but sustained recovery above that area would be needed before the outlook improves. A break and close above the resistance would confirm an uptrend toward $86.17 (the 50 day moving average), $89.19 (the 100 day moving average), and $91.75. I'd wait for a daily close before acting on the credit concerns driving the recent volatility.
Key Levels
- Latest Close $65.78 (10/14/26) Down 15.46%
- Key Support: $61.83 - $60.57, then $49.88
- Key Resistance: $70.59, then $76 - $80, $86.17 and $89.19
- RSI: Near 29 on supplied chart, not verified
- Breakout Target: Close above $76 - $80 resistance
- Breakdown Target: Close below $60.57
FAQ
Is CoreWeave's $104 Billion Backlog Guaranteed Cash?
No. The Backlog is future contracted revenue which is dependent upon service availability and delivery. In addition, CoreWeave has significant operating and funding costs.
What Is CRWV's Main Breakdown Level?
As shown on the supplied chart, $60.57 is the main support level. A confirmed daily close below $60.57 could trigger a decline to $49.88.
Bottom Line
CoreWeave has high demand but the risk is weighted towards the debt which is trading at a steep discount. CoreWeave’s bonds are trading below face value at elevated yields, making future financing more expensive; this is not a direct discount to the equity. I remain bearish below $70.59.
Nothing in this material constitutes investment advice, personal recommendation, investment research, an offer, or a solicitation to buy or sell any financial instrument. The content has been prepared without consideration of your individual investment objectives, financial situation, or needs, and should not be treated as such.
Past performance is not a reliable indicator of future performance and/or results. Forward-looking scenarios or forecasts are not a guarantee of future performance. Actual results may differ materially from those anticipated.
Mitrade makes no representation or warranty as to the accuracy or completeness of the information provided and accepts no liability for any loss arising from reliance on such information.
Recommended Articles


