CFDs are complex instruments and come with a high risk of losing money rapidly due to leverage. 74% of retail investor accounts lose money when trading CFDs with this provider. You should consider whether you understand how CFDs work and whether you can afford to take the high risk of losing your money.

Shiba Inu Price Forecast: SHIB bounces higher, eyes key resistance amid burn activity

Source Fxstreet
  • Shiba Inu is up 6% on Friday, bouncing off toward a crucial resistance zone.
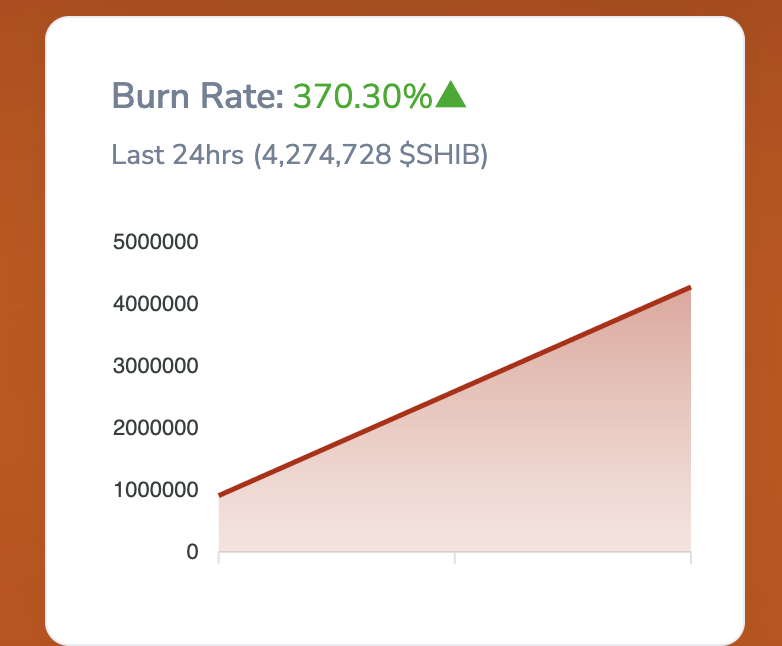
  • The Shibburn tracker shows 4.27 million SHIB tokens burned over the last 24 hours, likely easing downside pressure in the near term.
  • Derivatives data reflects risk-on sentiment among traders, anticipating further gains.

Shiba Inu (SHIB) extends gains nearly 6% at press time on Friday, after a Doji candle formation the previous day. Burning 4.27 million SHIB tokens over the last 24 hours eases overhead pressure on the meme coin, supporting the relief rally. The retail sentiment sees a quick bullish shift, boosting SHIB futures Open Interest. 

SHIB burn boosts retail, whale demand

Shiba Inu has burned 4.27 million SHIB over the last 24 hours amid efforts to limit inflation and avoid reaching its maximum supply of 999 trillion. This reduction in the circulating supply eases downside pressure on the meme coin, amounting to 410 trillion SHIB tokens.

Shiba Inu token burn metrics. Source: SHIBBURN

The derivatives market sentiment shows near-term risk appetite for SHIB aligning with the token burn-driven recovery. CoinGlass data shows that SHIB Open Interest (OI) is up 6.44% over the last 24 hours, reaching $55.69 million, indicating increased positional build-up. The long-to-short ratio was above 1 at 1.0251 on Friday, indicating more long positions are active in SHIB derivatives. 

SHIB derivatives data. Source: CoinGlass

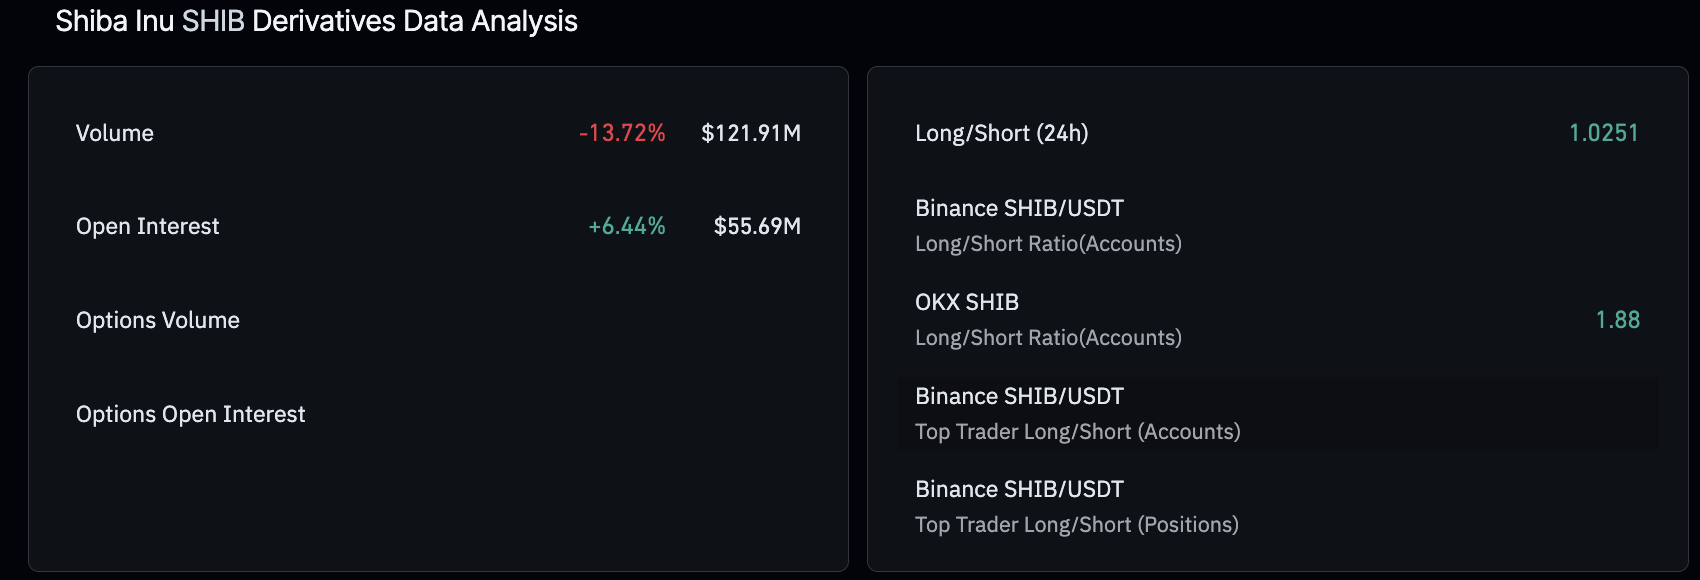
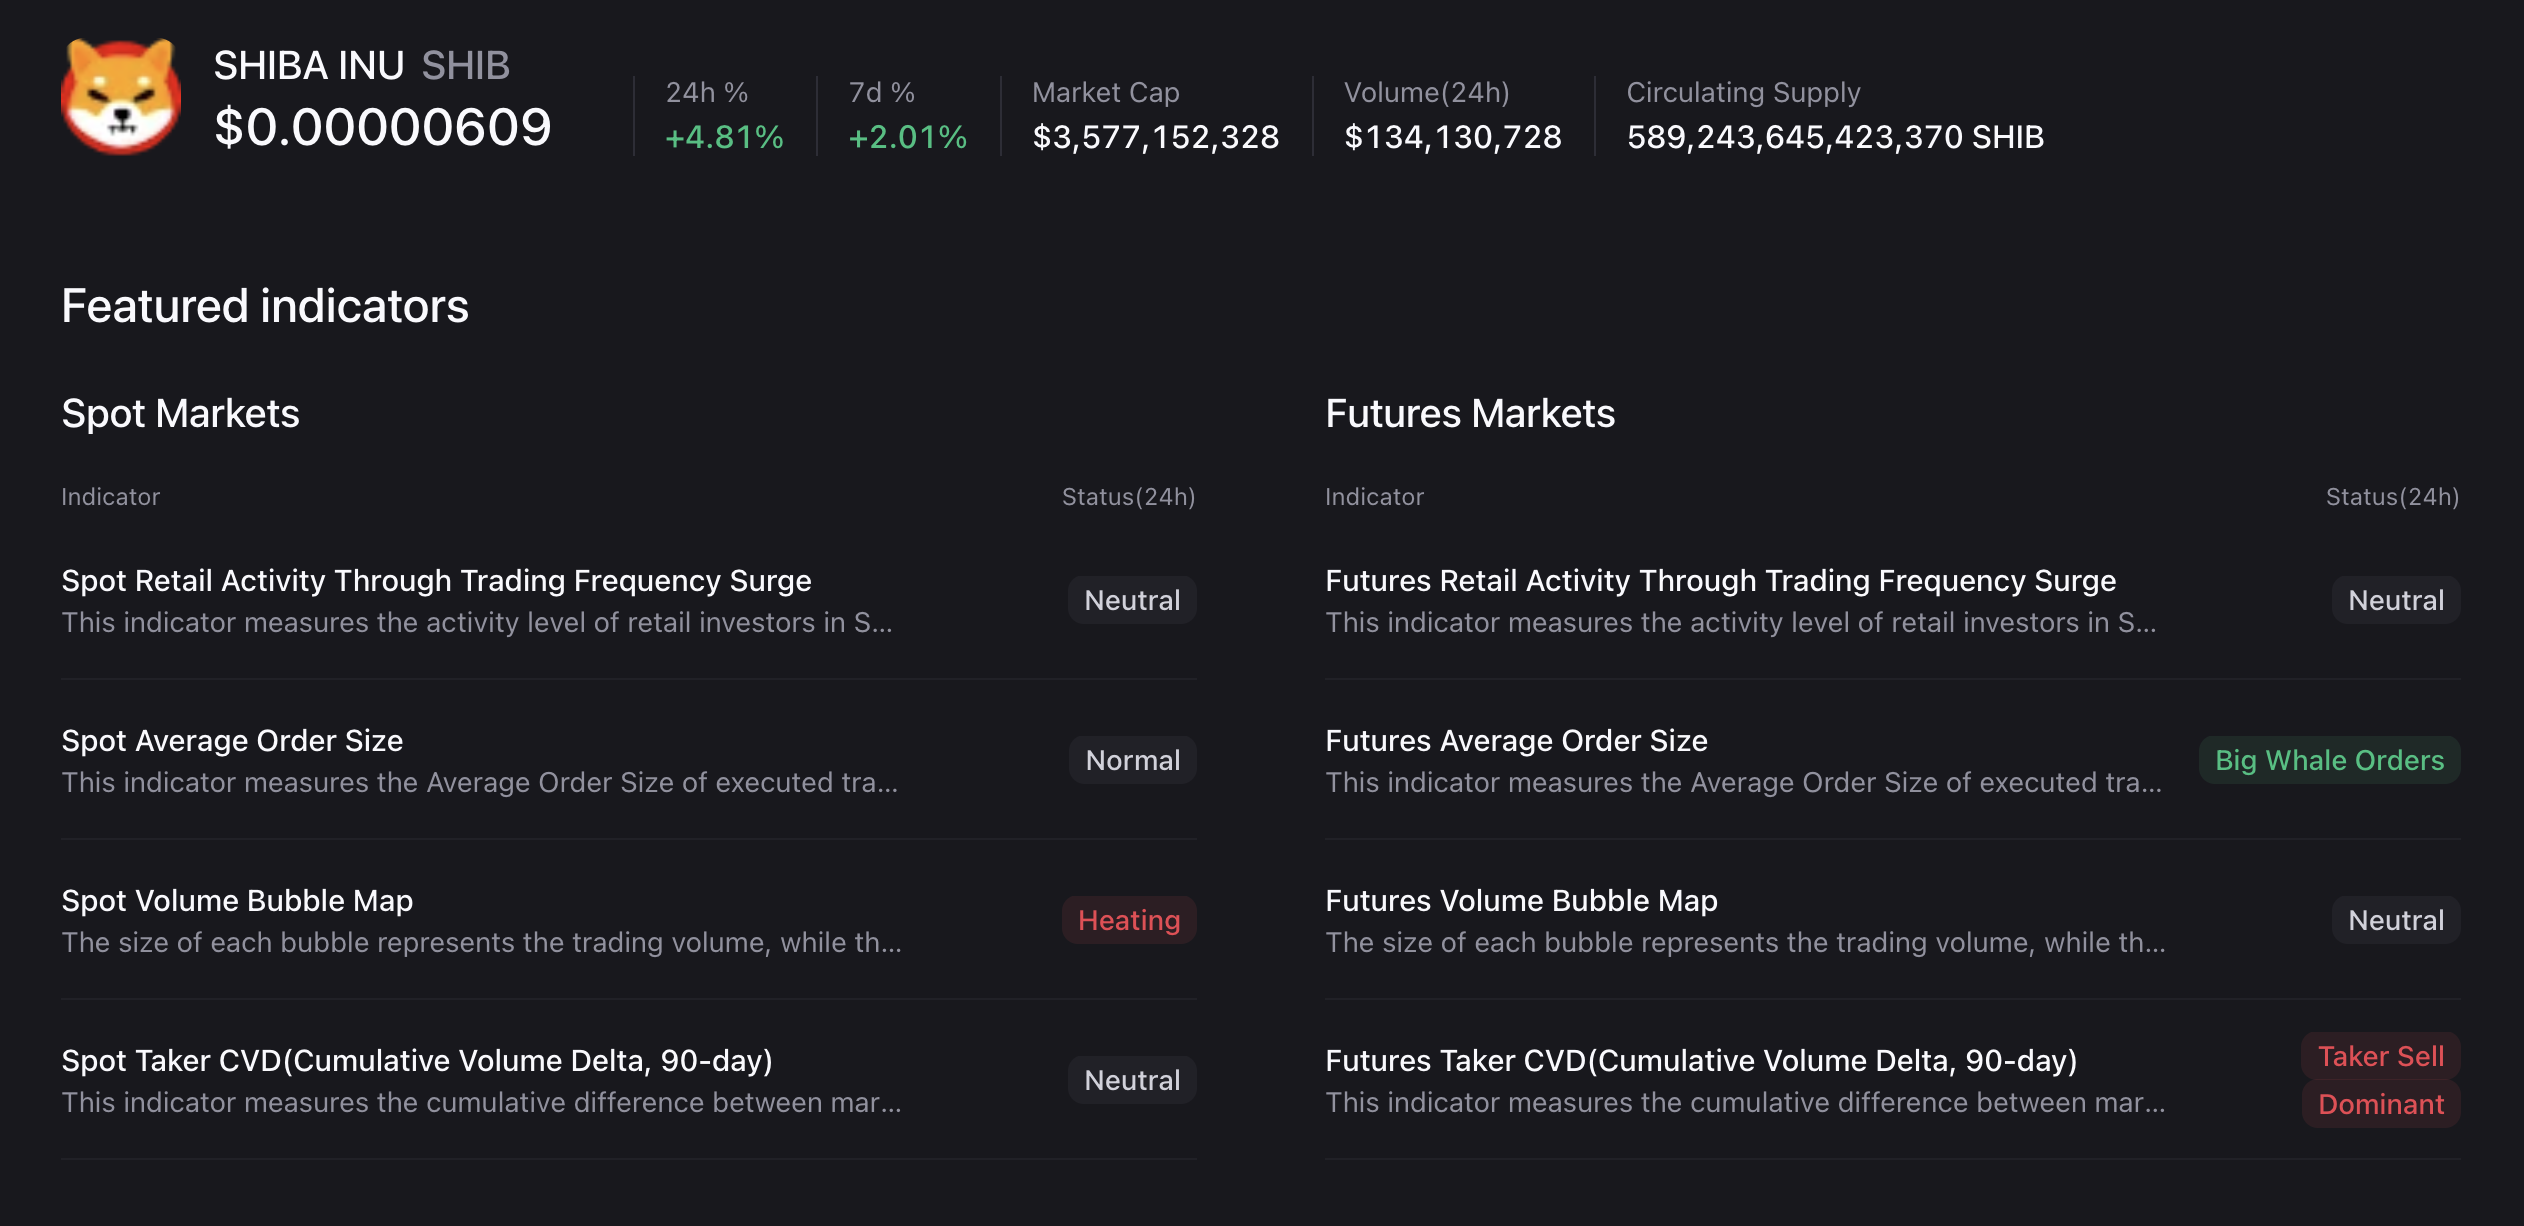
On the other hand, CryptoQuant data shows an increase in the average order size in the futures market, suggesting whale interest in the meme coin.

Shiba Inu metrics. Source: CryptoQuant

Technical outlook: Will Shiba Inu's recovery evolve into a breakout rally?

Shiba Inu is up 6% at the time of writing on Friday, extending trading above the $0.00000600 mark. The short-term recovery faces the overhead descending 50-day exponential moving average EMA at $0.00000624, close to a descending resistance line connecting the highs of February 14 and March 16. 

The meme coin should secure a daily close above this resistance zone to further extend gains, potentially targeting the R1 pivot point near $0.00000700. 

Momentum shows a shift in bullish bias as the selling pressure fades. 

The Relative Strength Index (RSI) at 54 rises above the midline with further room on the upside before reaching the overbought zone. Meanwhile, the Moving Average Convergence Divergence (MACD) steadily approaches the zero line while maintaining an upward trend above its signal line. At the same time, the expansion of positive histograms reaffirms the rising bullish momentum. 

SHIB/USDT daily price chart.

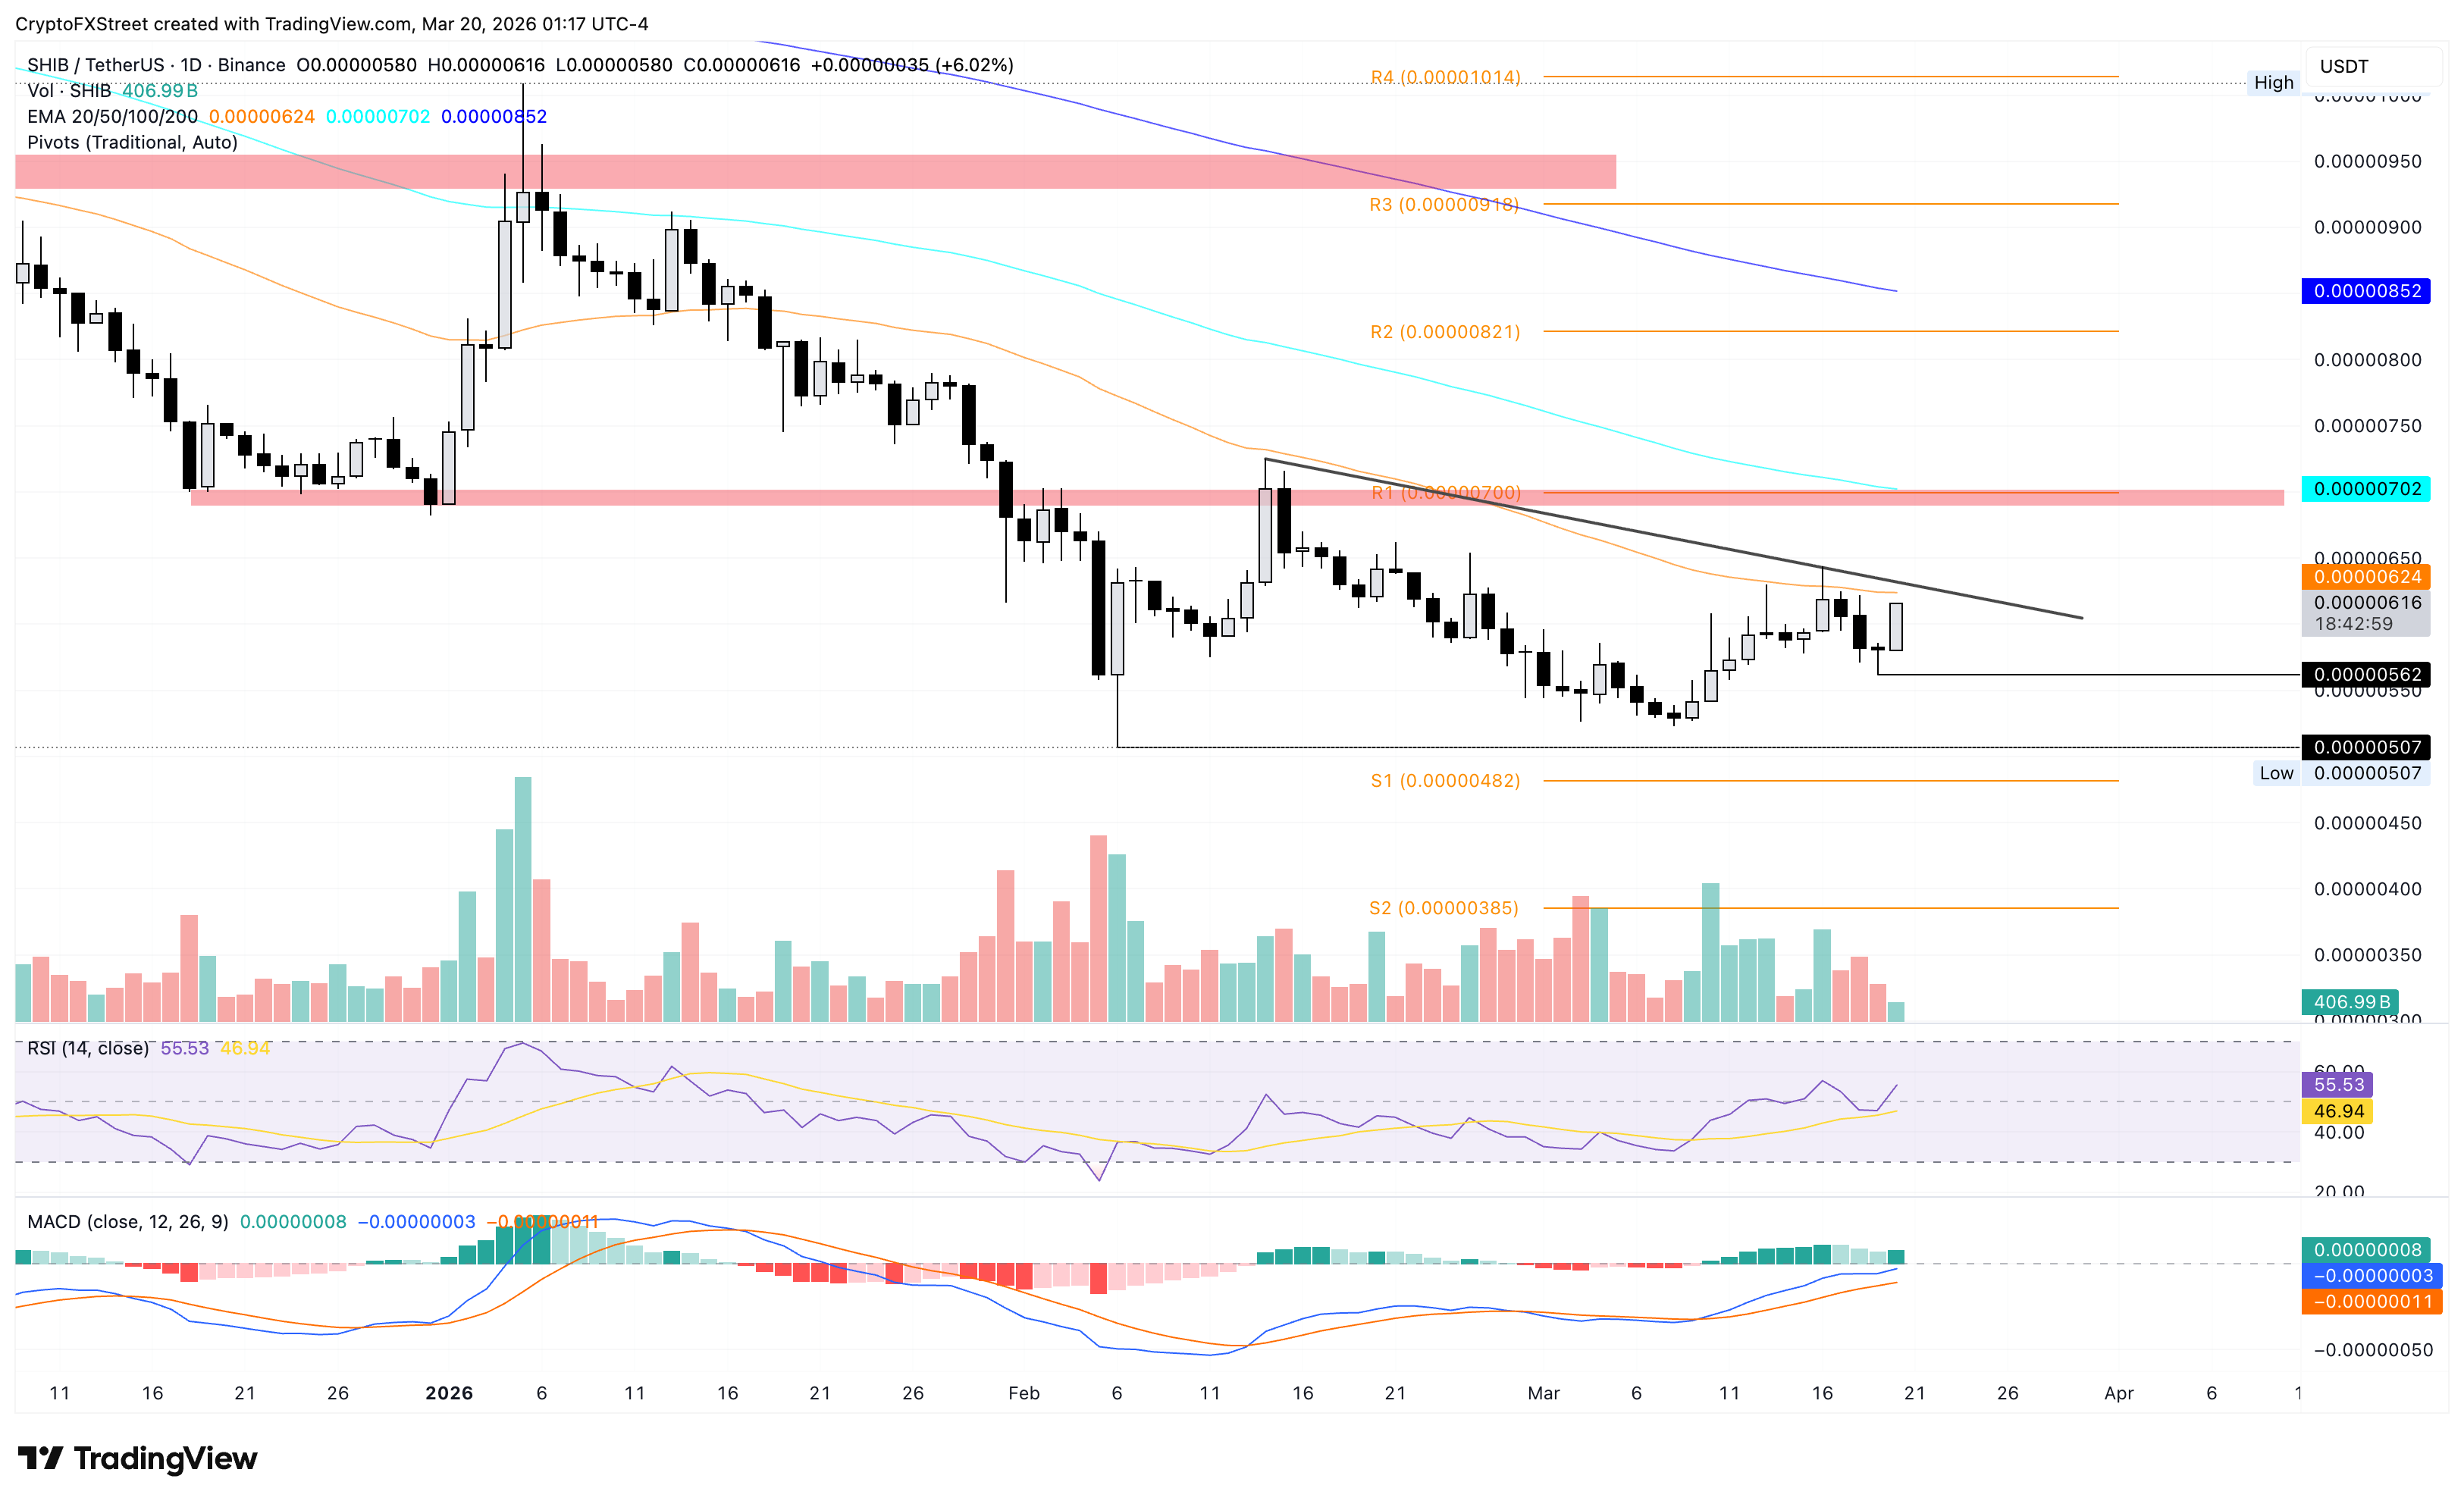
Looking down, a bearish close to the day would likely extend the prevailing three-day decline and put Friday's low of $0.00000562 at risk. A decisive close below this low could test the February 6 low at $0.00000507.

Disclaimer: The content available on Mitrade Insights is provided for informational and marketing purposes only. It has not been prepared in accordance with legal requirements designed to promote the independence of investment research and is not subject to any prohibition on dealing ahead of the dissemination of investment research
Nothing in this material constitutes investment advice, personal recommendation, investment research, an offer, or a solicitation to buy or sell any financial instrument. The content has been prepared without consideration of your individual investment objectives, financial situation, or needs, and should not be treated as such.
Past performance is not a reliable indicator of future performance and/or results. Forward-looking scenarios or forecasts are not a guarantee of future performance. Actual results may differ materially from those anticipated.
Mitrade makes no representation or warranty as to the accuracy or completeness of the information provided and accepts no liability for any loss arising from reliance on such information.
placeholder
Gold price surge helps Swiss National Bank make $33 billion profitZURICH, Jan 9 (Reuters) - The Swiss National Bank made a profit of around 26 billion Swiss francs ($32.52 billion) in 2025, the central bank said on Friday, thanks to big increases in gold prices as investors headed for safe-havens assets last year.The provisional figures were a decline from the rec...
Author  FXStreet
Jan 09, Fri
ZURICH, Jan 9 (Reuters) - The Swiss National Bank made a profit of around 26 billion Swiss francs ($32.52 billion) in 2025, the central bank said on Friday, thanks to big increases in gold prices as investors headed for safe-havens assets last year.The provisional figures were a decline from the rec...
placeholder
Silver price today: Silver rises, according to FXStreet dataSilver prices (XAG/USD) rose on Monday, according to FXStreet data. Silver trades at $81.78 per troy ounce, up 5.54% from the $77.48 it cost on Friday.
Author  FXStreet
Feb 09, Mon
Silver prices (XAG/USD) rose on Monday, according to FXStreet data. Silver trades at $81.78 per troy ounce, up 5.54% from the $77.48 it cost on Friday.
placeholder
WTI drops below $64.00, Middle East tensions in focusWest Texas Intermediate (WTI), the US crude oil benchmark, is trading around $63.80 during the early Asian trading hours on Tuesday. The WTI price falls as concerns about supply disruptions in the Middle East have faded.
Author  FXStreet
Feb 10, Tue
West Texas Intermediate (WTI), the US crude oil benchmark, is trading around $63.80 during the early Asian trading hours on Tuesday. The WTI price falls as concerns about supply disruptions in the Middle East have faded.
placeholder
Silver Price Forecast: XAG/USD bulls seem hesitant below $82.00; US NFP awaitedSilver (XAG/USD) steadies following the previous day's modest pullback from the $84.00 mark and trades with a mild positive bias during the Asian session on Wednesday.
Author  FXStreet
Feb 11, Wed
Silver (XAG/USD) steadies following the previous day's modest pullback from the $84.00 mark and trades with a mild positive bias during the Asian session on Wednesday.
placeholder
Financial Markets 2026: Volatility Catalysts in Gold, Silver, Oil, and Blue-Chip Stocks—A CFD Trader's OutlookThe financial world is perpetually in motion, but the landscape for 2026 seems to be shaping up to be particularly dynamic. For CFD traders navigating global markets, this heightened volatility could present a distinctive set of challenges and opportunities.
Author  Rachel Weiss
Mar 05, Thu
The financial world is perpetually in motion, but the landscape for 2026 seems to be shaping up to be particularly dynamic. For CFD traders navigating global markets, this heightened volatility could present a distinctive set of challenges and opportunities.
goTop
quote