


CFDs are complex instruments and come with a high risk of losing money rapidly due to leverage. 80% of retail investor accounts lose money when trading CFDs with this provider. You should consider whether you understand how CFDs work and whether you can afford to take the high risk of losing your money.

Pi Network Price Forecast: PI struggles below $0.10 amid Testnet’s upgrade to Protocol 27

Source Fxstreet
  • Pi Network is down by over 2% on Monday, holding above a crucial support level at $0.08537.
  • Pi Core Team announced the release of Protocol 27 on Testnet following a successful mainnet upgrade to Protocol 26.
  • The technical outlook is mixed as price remains capped below $0.1000 and lacks decisive momentum.

Pi Network (PI) trades in the red on Monday, easing after a gain of over 6% last week. Pi Core Team released Protocol 27 on Pi Testnet on Saturday, opening the door to new smart contract authentication capabilities. The technical outlook for PI remains mixed as the price lacks momentum and remains capped below $0.1000.

Pi Testnet upgrade

Pi Network, built on the Stellar Consensus Protocol (SCP), is heading toward new smart contract authentication capabilities. Pi Core Team, in a social media post on Saturday, announced the release of the new Stellar network Protocol 27 to the Pi Testnet. 

Core Team targets the Pi Mainnet upgrade to Protocol 27 on September 15, which would enable advanced ways for mainnet apps and users to authenticate transactions.

https://x.com/PiCoreTeam/status/2090904185554534501

Technical outlook: Could PI extend gains above $0.10?

Pi Network trades around $0.0880 on Monday, maintaining a neutral near-term tone as the price consolidates above $0.0800. From a technical perspective, PI remains trapped between 23.6% and 50% retracement levels of the downswing from $0.1341 to $0.0703, at $0.1022 and $0.0853, respectively.

The Moving Average Convergence Divergence (MACD) remains marginally positive above its signal line on the daily chart, hinting at tentative underlying demand. At the same time, the Relative Strength Index (RSI) around 48 keeps momentum broadly neutral, reinforcing the notion of consolidation.

For a sustained rally, PI must sustain a confirmed breakout above $0.1022, which could open the path toward the 78.6% Fibonacci retracement level at $0.1204.
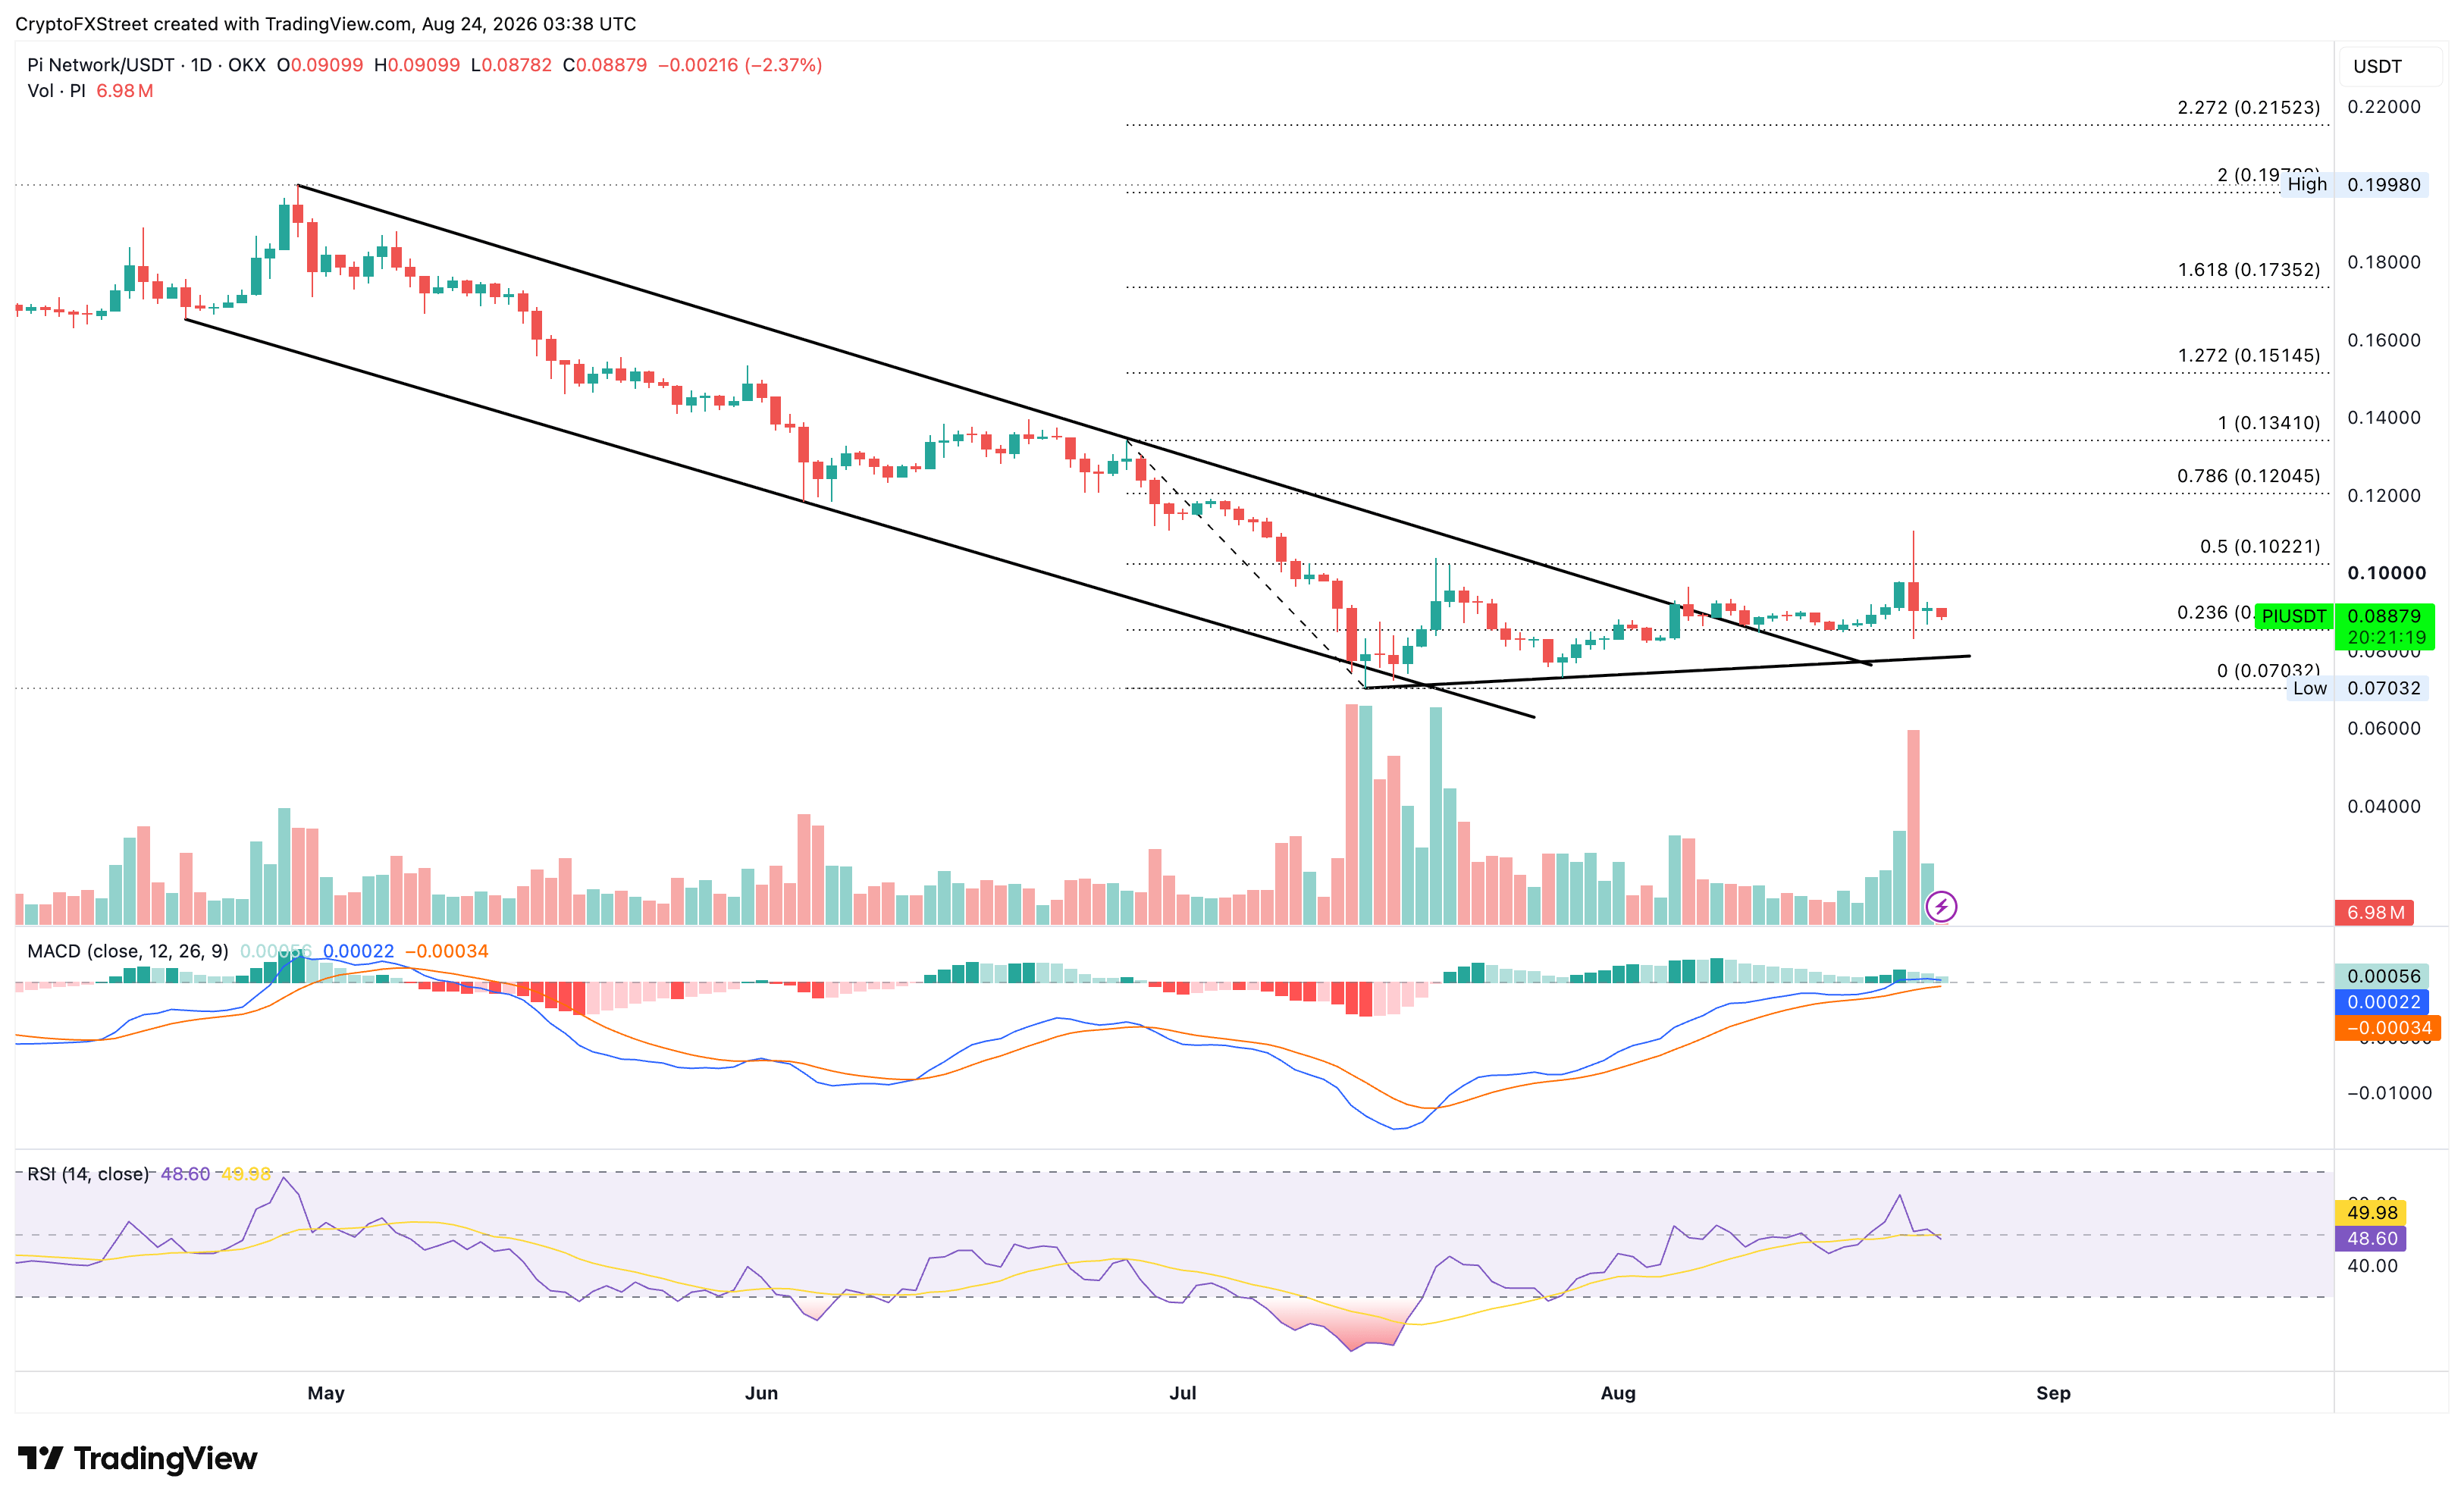
PI/USDT daily price chart.

Looking down, the key support for PI remains at $0.0853, followed by the near-term rising trendline around $0.0785 and the $0.0703 swing low.

(The technical analysis of this story was written with the help of an AI tool. Know more.)

Disclaimer: The content available on Mitrade Insights is provided for informational and marketing purposes only. It has not been prepared in accordance with legal requirements designed to promote the independence of investment research and is not subject to any prohibition on dealing ahead of the dissemination of investment research
Nothing in this material constitutes investment advice, personal recommendation, investment research, an offer, or a solicitation to buy or sell any financial instrument. The content has been prepared without consideration of your individual investment objectives, financial situation, or needs, and should not be treated as such.
Past performance is not a reliable indicator of future performance and/or results. Forward-looking scenarios or forecasts are not a guarantee of future performance. Actual results may differ materially from those anticipated.
Mitrade makes no representation or warranty as to the accuracy or completeness of the information provided and accepts no liability for any loss arising from reliance on such information.
placeholder
The Trumponomics Ebook: Oil Price Volatility in the Iran War Understand how the Strait of Hormuz shock moved markets, and what CFD traders watched next.
Author  Rachel Weiss
Aug 18, Tue
Understand how the Strait of Hormuz shock moved markets, and what CFD traders watched next.
placeholder
WTI consolidates below $84.50, two-week top as bullish bias remains amid Hormuz standoffWest Texas Intermediate (WTI) – the benchmark US Crude Oil price – extends its consolidative price move through the first half of the European session and currently trades near the $84.25-$84.30 area, close to a two-week high set earlier this Tuesday.
Author  FXStreet
Aug 18, Tue
West Texas Intermediate (WTI) – the benchmark US Crude Oil price – extends its consolidative price move through the first half of the European session and currently trades near the $84.25-$84.30 area, close to a two-week high set earlier this Tuesday.
placeholder
Silver Price Forecast: XAG/USD remains sideways around $65, FOMC takes centre stageSilver price (XAG/USD) continues to trade in a limited range at around $65.30 during the European trading session on Tuesday.
Author  FXStreet
Aug 18, Tue
Silver price (XAG/USD) continues to trade in a limited range at around $65.30 during the European trading session on Tuesday.
placeholder
BTC holds recent gains above 50-day EMA amid improving momentumBitcoin (BTC) slides slightly but holds most of the recent gains, reclaiming the 50-day Exponential Moving Average (EMA) at $64,300 at the time of writing on Tuesday after rising 2.5% the previous day.
Author  FXStreet
Aug 18, Tue
Bitcoin (BTC) slides slightly but holds most of the recent gains, reclaiming the 50-day Exponential Moving Average (EMA) at $64,300 at the time of writing on Tuesday after rising 2.5% the previous day.
placeholder
Gold steadies below $4,350 as surging yields offset support from Fed rate-hold betsGold price (XAU/USD) holds steady near $4,335 after pulling back from an early-June top near $4,450 during the early Asian trading hours on Wednesday.
Author  FXStreet
Aug 19, Wed
Gold price (XAU/USD) holds steady near $4,335 after pulling back from an early-June top near $4,450 during the early Asian trading hours on Wednesday.
goTop
quote