



Zcash Price Forecast: ZEC rally hits record high in a parallel channel amid network growth
- Zcash hovers above $1,600 on Wednesday, following a 10% jump the previous day.
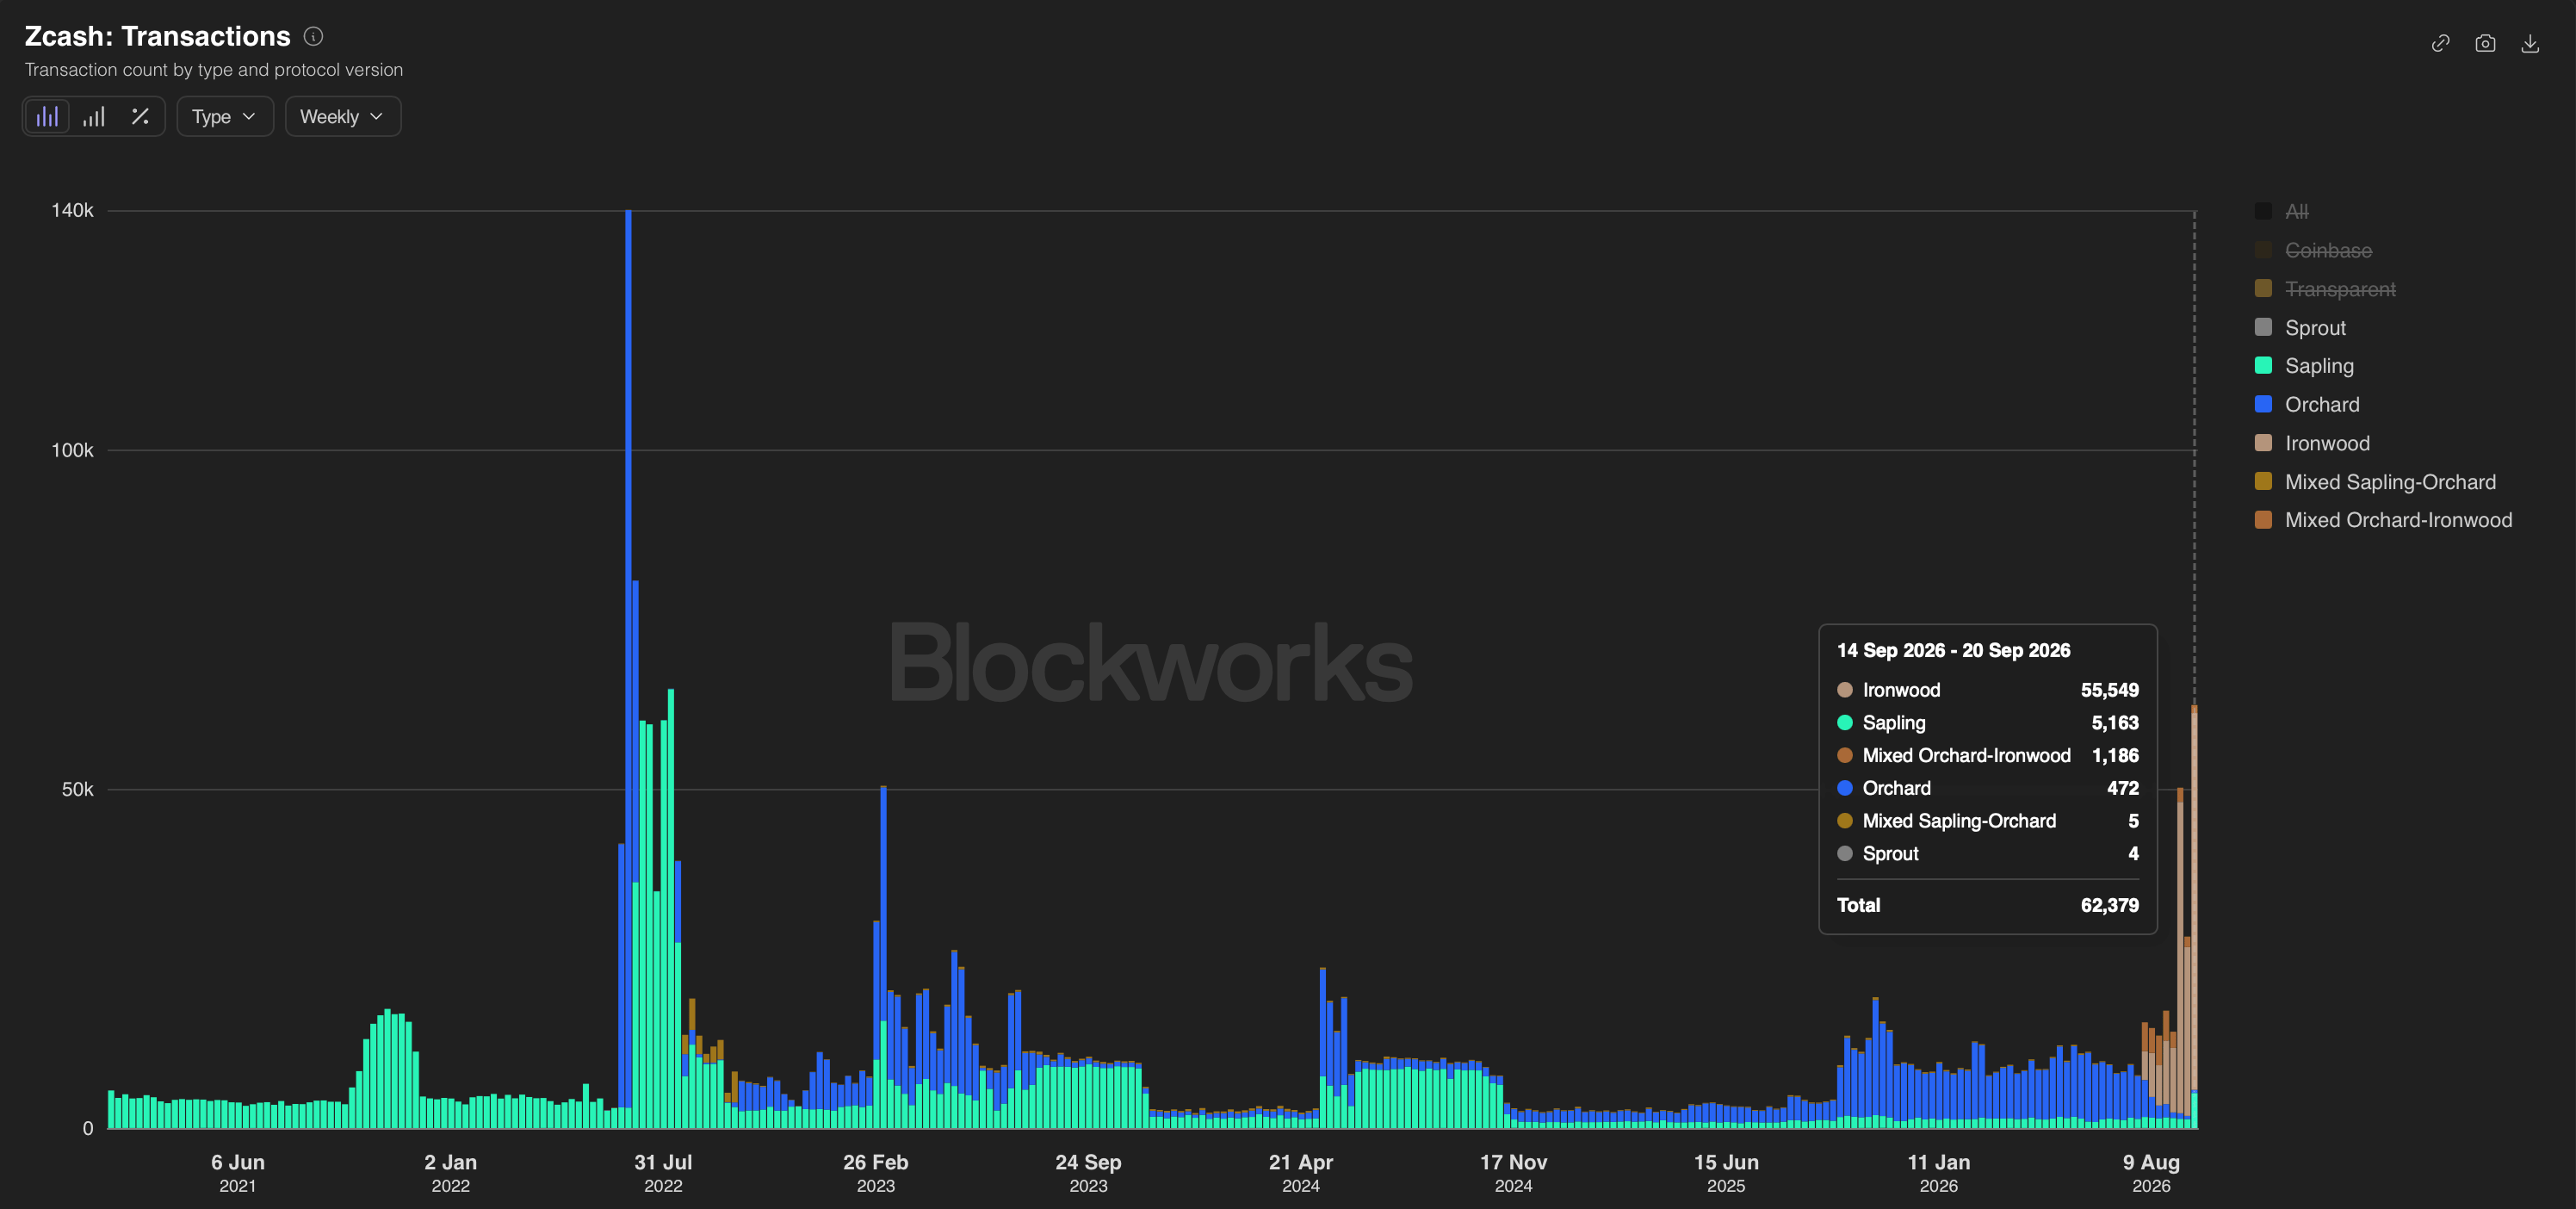
- Privacy-focused shielded weekly activity on Zcash recorded a four-year high with over 62,000 transactions last week.
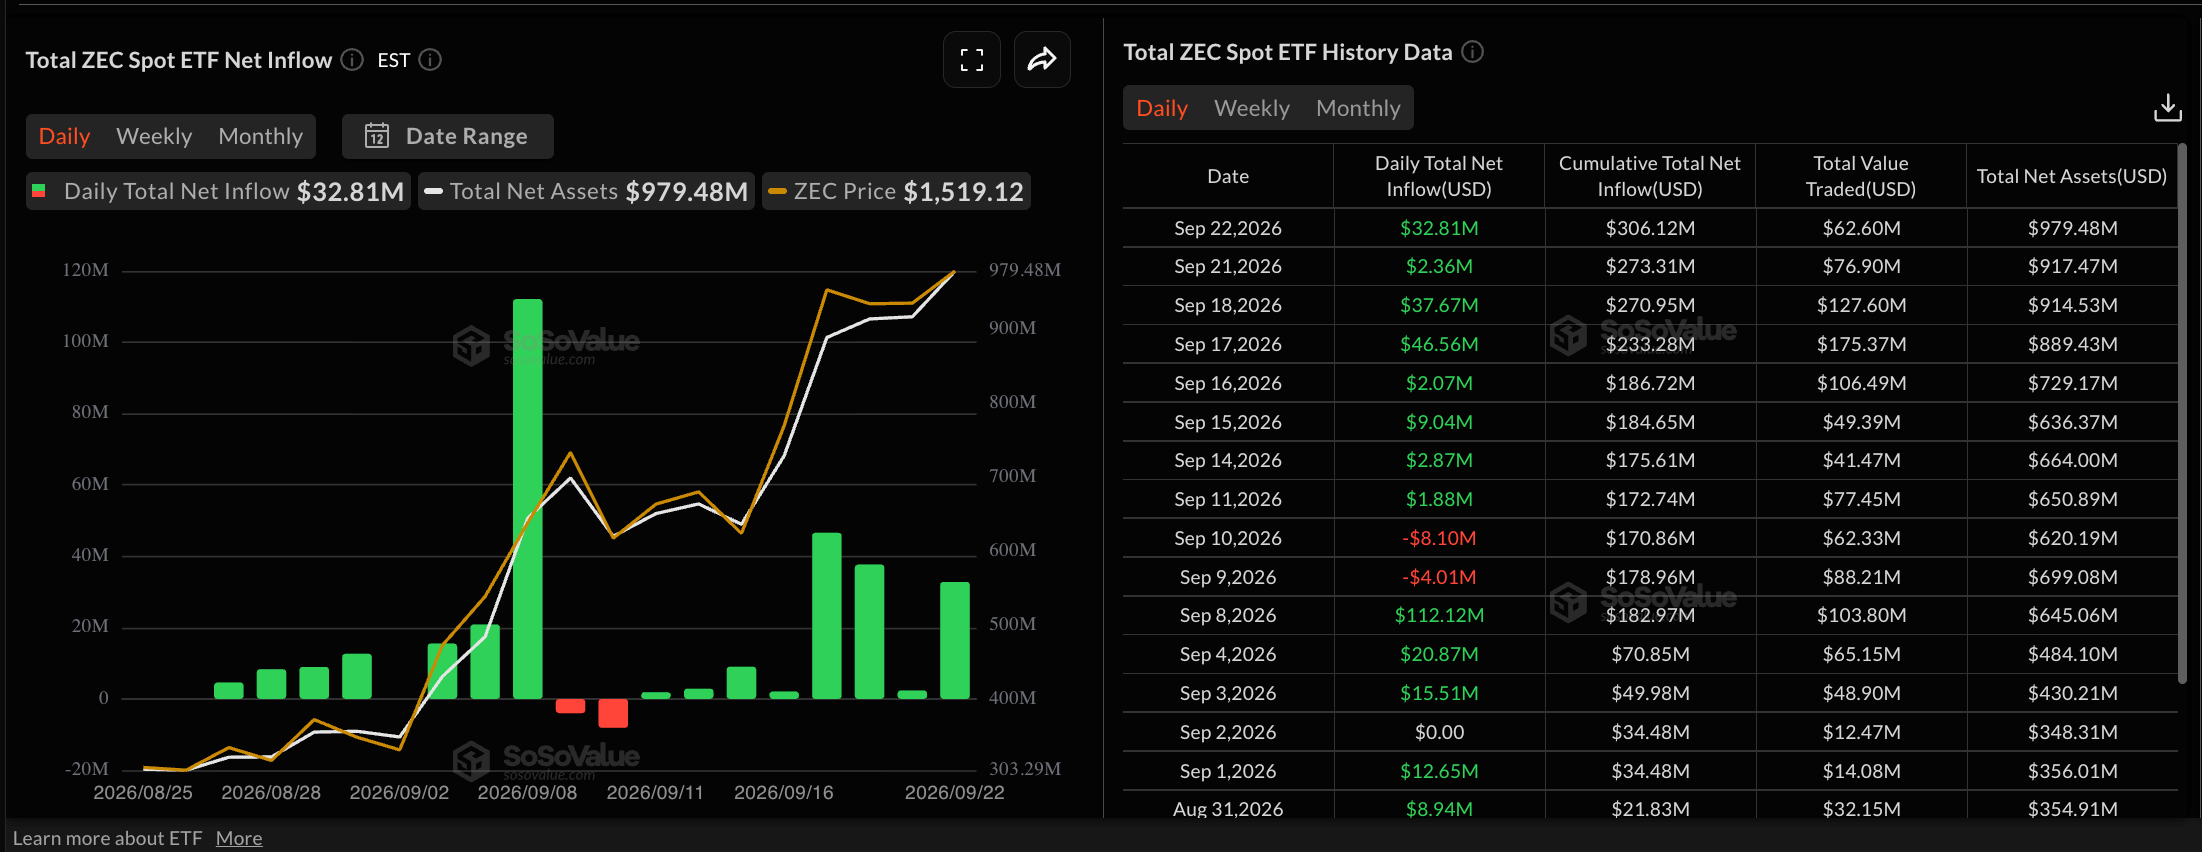
- Institutional confidence in Zcash remains firm as Grayscale’s ZCSH fund recorded over $32 million in inflows on Tuesday.
Zcash (ZEC) rally continues to scale higher, trading above $1,600 at press time on Wednesday after a 10% jump the previous day. The privacy-focused token witnesses a surge in shielded activity, recording the highest weekly total since 2022, while Grayscale’s ZEC-focused fund logged over $30 million in inflows on Tuesday. The technical outlook for Zcash indicates an upside bias, as the price rally is forming a bullish channel pattern.
Shielded activity and ETF inflows back ZEC rally
Shielded activity on Zcash is gaining traction, indicating increased adoption of the privacy network. Blockworks data shows that shielded transactions totaled 62,379 last week, the highest in the last four years, driven mainly by 55,549 transactions in the latest Ironwood pool.
On the other hand, Grayscale’s ZEC-focused Exchange-Traded Fund (ETF) recorded $32.81 million in inflows the previous day, bringing total net assets under management to $979.48 million. In addition, the recently launched ZEC-focused Exchange Traded Product (ETP) on Euronext by 21Shares adds to the institutional confidence in the privacy token.
Taken together, the metrics suggest Zcash is poised for further upside driven by network adoption and institutional demand.
Technical outlook: Zcash above $1,600 nears a parabolic breakout attempt
Zcash trades around $1,606 on Wednesday, sustaining its bullish near-term bias. The privacy token holds well above the 50-, 100-, and 200-period Exponential Moving Averages (EMAs) on the four-hour chart at $1,424, $1,295, and $1,108, respectively.
From a technical perspective, Zcash is inching closer to an overhead resistance trendline connecting the highs of August 23 and September 19 near $1,700. On the flip side, a rising support trendline connecting the lows of September 2 and 16 completes a bullish channel pattern on the four-hour chart. A confirmed breakout above this resistance trendline could extend the privacy token's rally into price-discovery mode, likely heading toward the $2,000 psychological threshold.
The Moving Average Convergence Divergence (MACD) stays in positive territory and crosses above the signal line, indicating persistent bullish momentum. At the same time, the Relative Strength Index (RSI) at 63 suggests firm but not yet overbought momentum, hinting that buyers retain control.
On the downside, initial support aligns with the September 19 high at $1,595, followed by the September 18 low at $1,422, which is reinforced by the 50-period EMA at $1,424.
(The technical analysis of this story was written with the help of an AI tool. Know more.)
Nothing in this material constitutes investment advice, personal recommendation, investment research, an offer, or a solicitation to buy or sell any financial instrument. The content has been prepared without consideration of your individual investment objectives, financial situation, or needs, and should not be treated as such.
Past performance is not a reliable indicator of future performance and/or results. Forward-looking scenarios or forecasts are not a guarantee of future performance. Actual results may differ materially from those anticipated.
Mitrade makes no representation or warranty as to the accuracy or completeness of the information provided and accepts no liability for any loss arising from reliance on such information.
Recommended Articles


