



Pi Network Price Forecast: PI remains under pressure near record lows as bears dominate
- Pi Network remains under pressure on Monday after setting a fresh all-time low near $0.0600 on Saturday.
- Derivatives positioning points to persistent bearish sentiment among PI traders.
- The technical outlook remains bearish, with PI hovering near record-low territory as sellers retain control.
Pi Network (PI) extends its decline on Monday, approaching the all-time low (ATL) of $0.0600 recorded over the weekend. Bearish sentiment in the derivatives market adds to selling pressure, and a deteriorating technical outlook suggests that downside risks remain elevated, leaving PI vulnerable to fresh lows if sellers maintain control.
Derivatives metrics suggest deeper correction
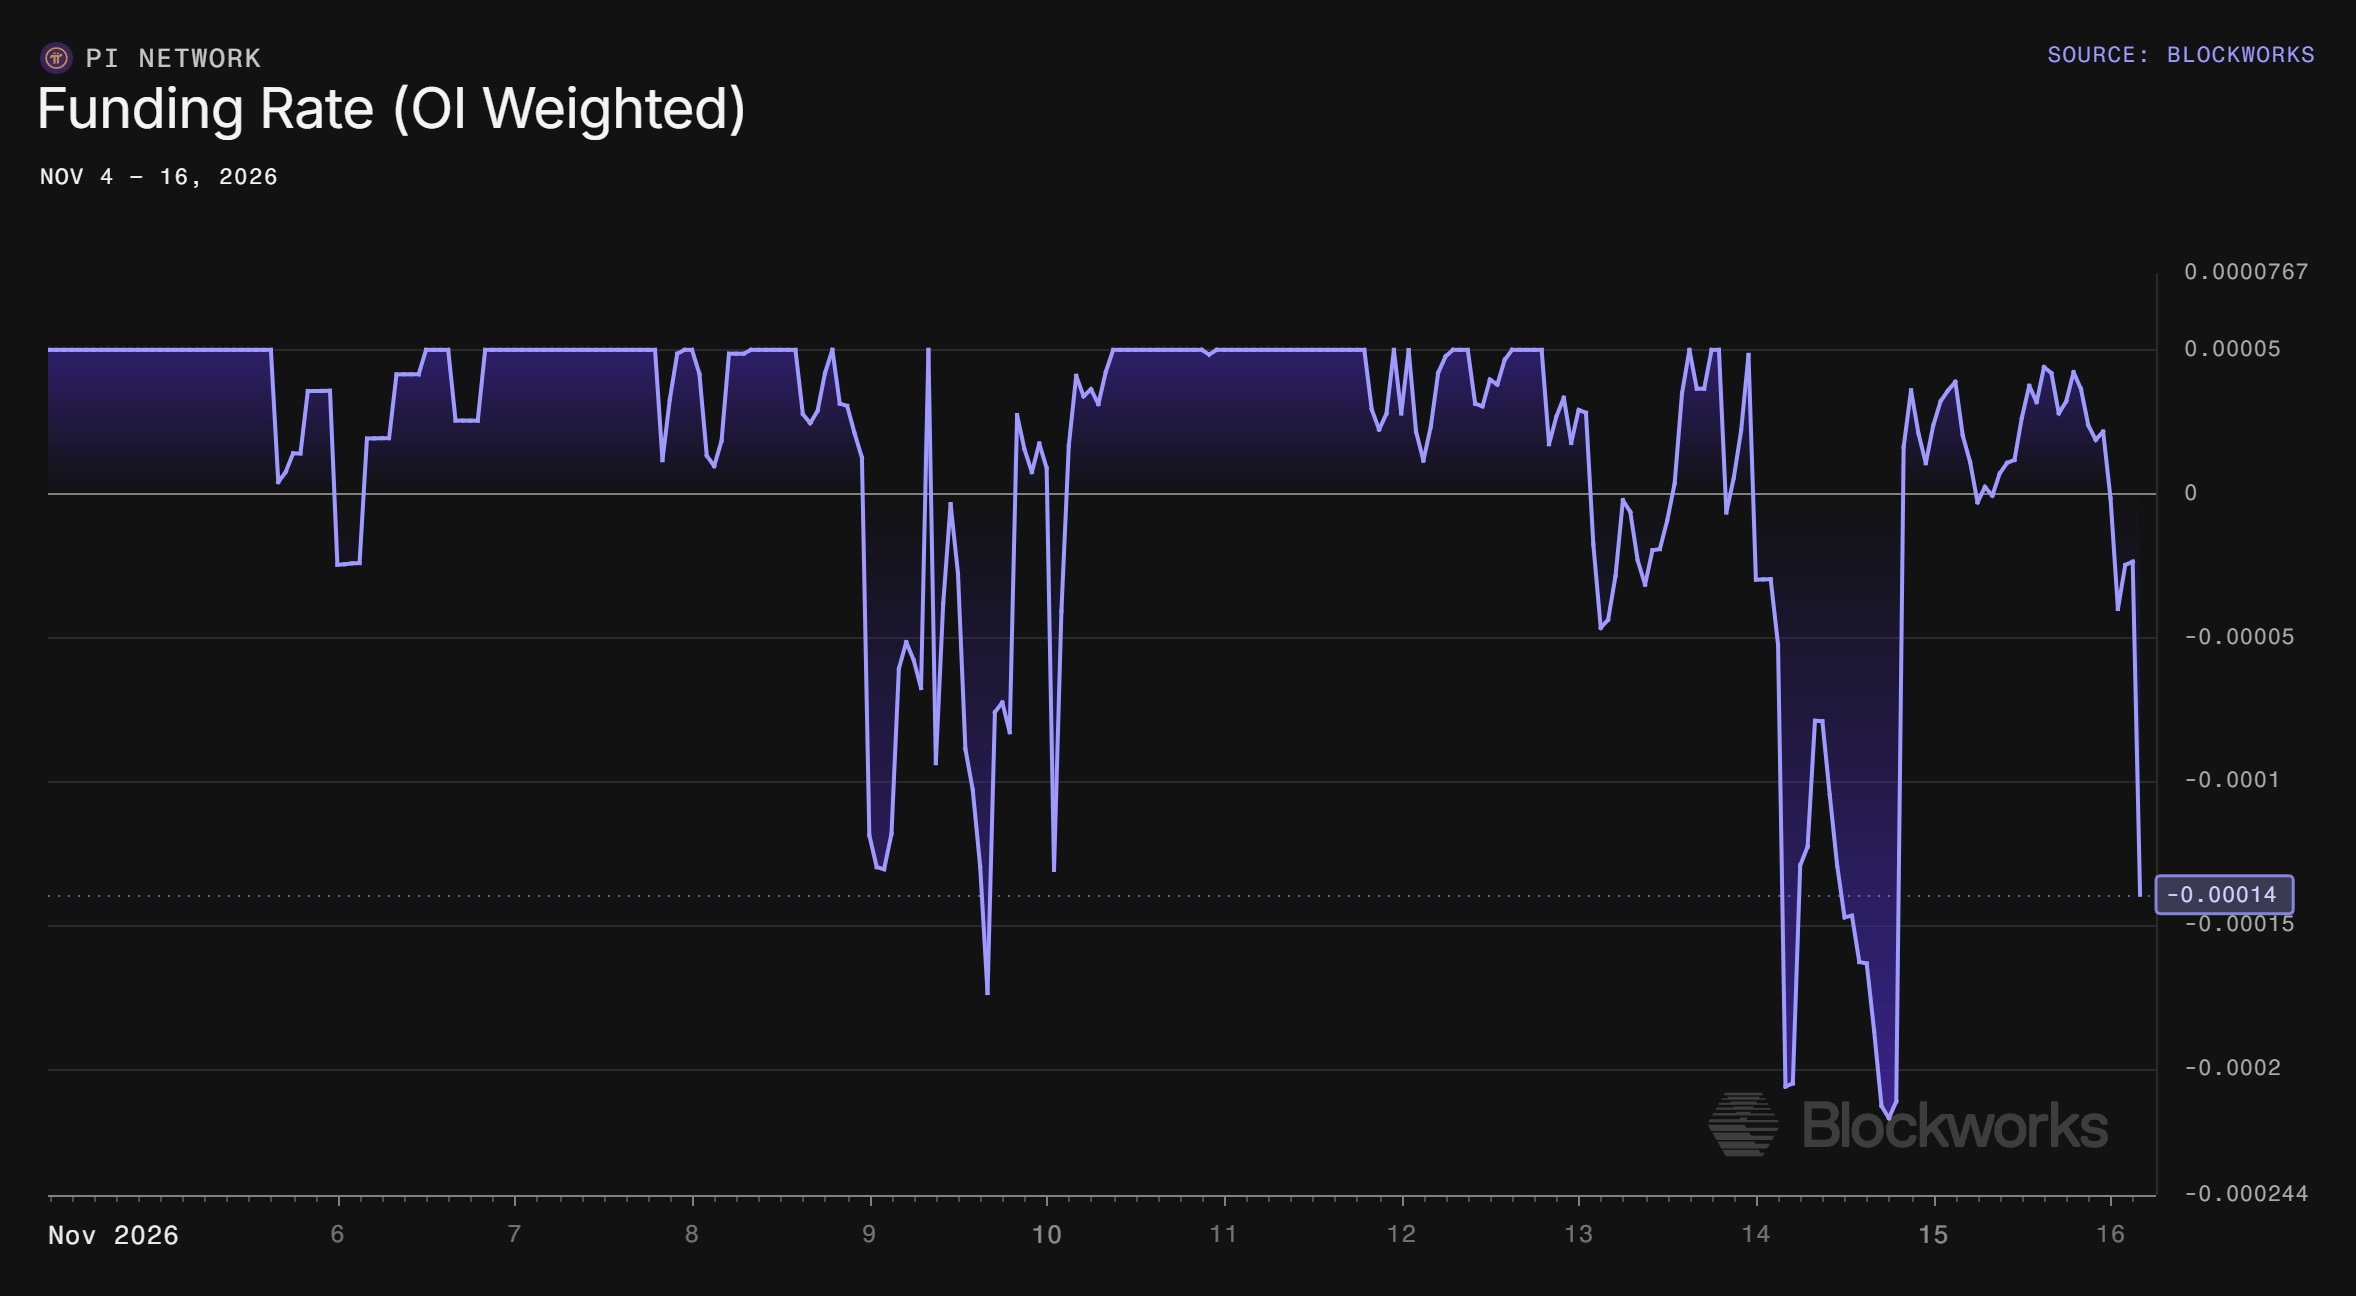
Derivatives positioning points to persistent bearish sentiment for Pi Network. The Blockworks chart below shows that PI's Open Interest (OI)-weighted funding rate turned negative, dropping to -0.00014% on Monday, indicating that shorts are paying longs and dominating perpetual futures positioning.
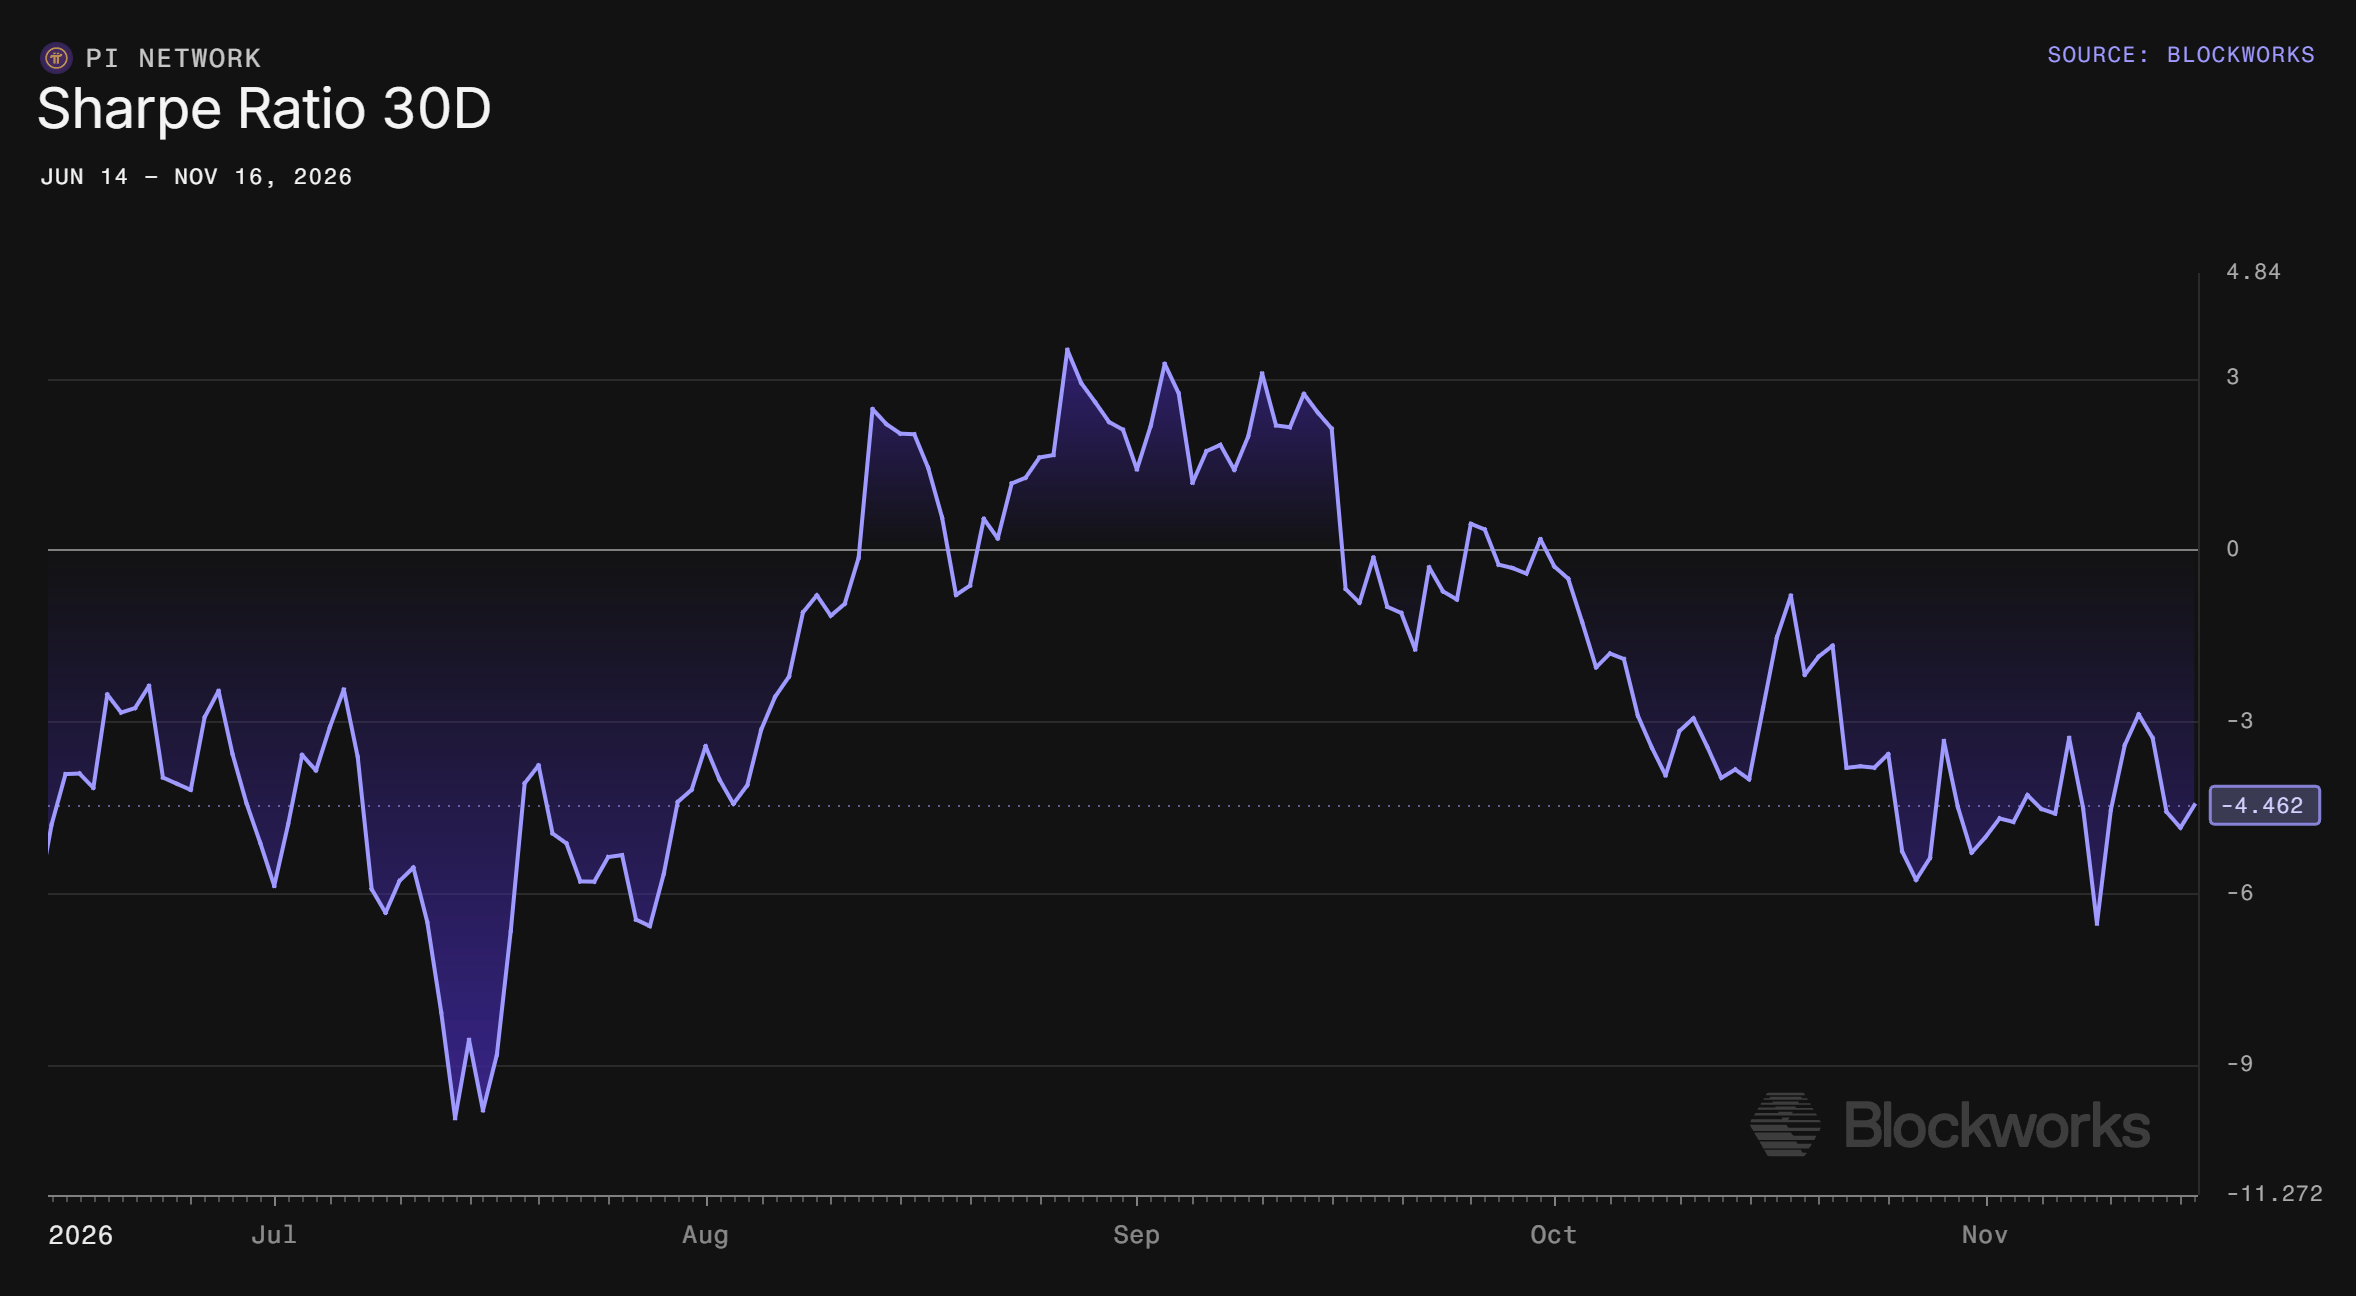
In addition, the 30-day Sharpe ratio has fallen to -4.462 on Monday, highlighting deteriorating risk-adjusted returns as Pi Network's recent decline continues to weigh on market performance. Moreover, the metric has remained below zero since October, suggesting that investors continue to face negative returns relative to the volatility they are exposed to.
Together, both the OI-weighted funding rate and the 30-day Sharpe ratio suggest that bearish sentiment remains dominant among PI traders.
Pi Network Price Forecast: Is PI heading to set a new record low?
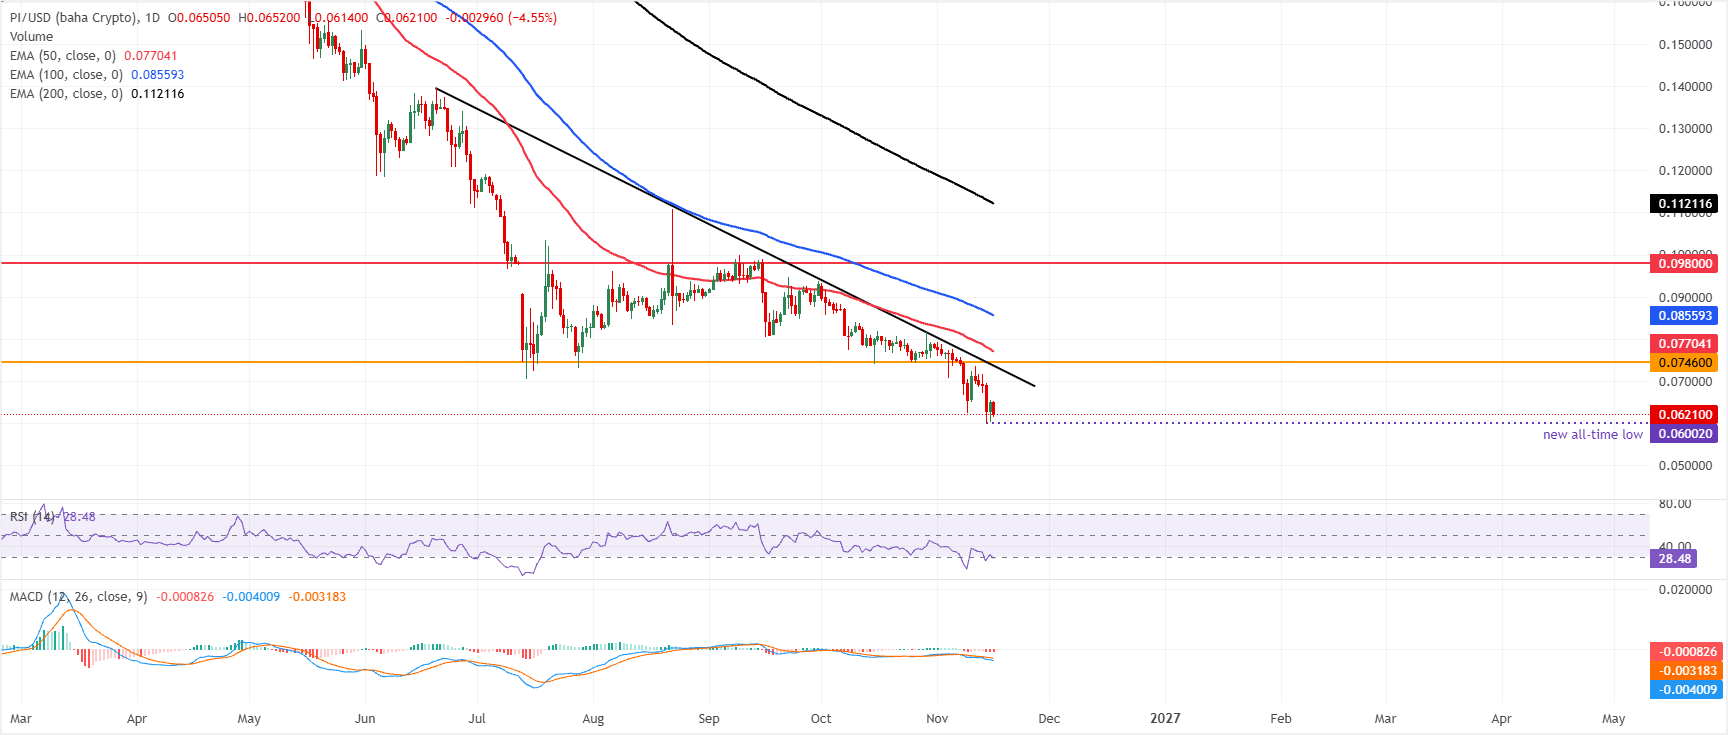
Pi Network price trades at $0.062 at the time of writing on Monday, after setting a fresh all-time low near $0.0600 on Saturday. In addition, PI is extending its slide well below the main Exponential Moving Averages (EMAs) and keeping the near-term bias firmly bearish.
The 50-day EMA at $0.077, the 100-day EMA at $0.085 and the 200-day EMA at $0.112 all sit overhead and collectively suggest a capped market while price remains beneath them.
Momentum reinforces this weak tone on the daily chart, with the Relative Strength Index (RSI) hovering in oversold territory near 28 and the Moving Average Convergence Divergence (MACD) with a negative histogram, hinting at persistent downside pressure despite the stretched conditions.
On the topside, initial resistance appears near the downward trendline at $0.073, followed by a horizontal barrier at $0.074, forming a first supply cluster just above current levels. A stronger recovery would face further resistance at the 50-day EMA at $0.077 and then the 100-day EMA at $0.085, ahead of the more distant horizontal cap at $0.098 and the 200-day EMA at $0.112.
With no clear structural support levels defined below $0.061, the pair remains vulnerable to further declines until buyers can reclaim the nearer resistance band and start building a base.
(The technical analysis of this story was written with the help of an AI tool. Know more.)
Nothing in this material constitutes investment advice, personal recommendation, investment research, an offer, or a solicitation to buy or sell any financial instrument. The content has been prepared without consideration of your individual investment objectives, financial situation, or needs, and should not be treated as such.
Past performance is not a reliable indicator of future performance and/or results. Forward-looking scenarios or forecasts are not a guarantee of future performance. Actual results may differ materially from those anticipated.
Mitrade makes no representation or warranty as to the accuracy or completeness of the information provided and accepts no liability for any loss arising from reliance on such information.
Recommended Articles


