



Ripple Price Forecast: XRP risks losing $1.00 support as 24-hour liquidations hit $20 million
- XRP corrects and trades around $1.00 amid growing selling pressure and technical weakness.
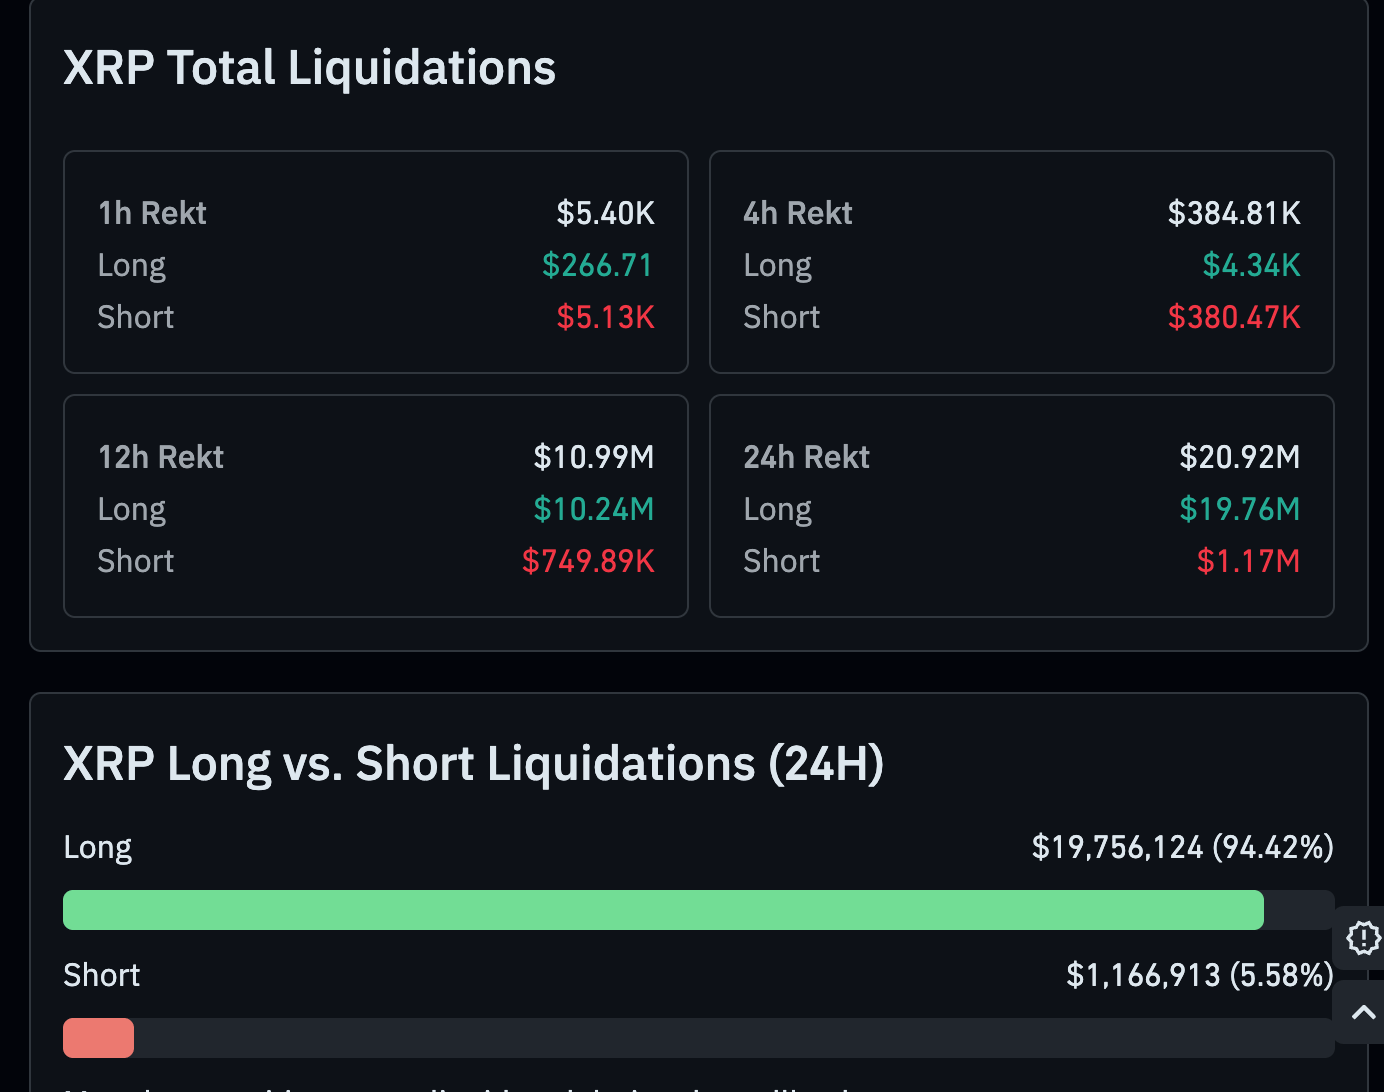
- XRP derivatives hit hard, with 24-hour liquidations exceeding $20 million.
- XRP remains heavily oversold with a negative MACD indicator, but recovery prospects seem limited.
Ripple (XRP) remains on edge, trading around $1.00 on Friday. The remittance token’s sharp decline has persisted since November 5, initially triggered by the $6.3 billion Binance hack and later accentuated by the United States (US) midterm elections.
The US Consumer Price Index (CPI) report released earlier this week showed inflation increased mildly, reinforcing broad expectations that the Federal Reserve (Fed) will hike interest rates in December.
XRP liquidations weigh on price action
Appetite for digital assets remains significantly weak, as reflected in the Fear & Greed Index, which held at 20 in Extreme Fear territory on Friday, down from 28 the previous day. This outlook aligns with the ongoing sell-off in the broader crypto market and in XRP derivatives.
CoinGlass data shows that 24-hour liquidations average over $20 million, mostly in long positions. Only $1.2 million in short positions has been liquidated over the period, indicating that bulls are taking the biggest hit. Persistent liquidations could put more pressure on XRP, as more traders are forced to close their positions.
Technical analysis: XRP falters as sellers gain ground
XRP trades at $1.03, extending a clear bearish bias as price holds well beneath the short- and long-term Exponential Moving Averages (EMAs) and the active SuperTrend line. A dense overhead structure is pressing the pair lower, with the 10-day SuperTrend at $1.19 leading a series of exponential moving averages, including the 50-day EMA at $1.26, the downward resistance trendline break level at $1.27, the 100-day EMA at $1.29, and the 200-day EMA at $1.34.
Momentum conditions reinforce the downside tone, as the Moving Average Convergence Divergence (MACD) remains in negative territory with a weak profile, while the Relative Strength Index (RSI) at 22 slips deep into oversold territory, hinting that while pressure is strong, the market is vulnerable to short-lived corrective bounces rather than a sustained recovery for now.
With no meaningful support levels defined below the current price in the current dataset, the focus stays on the pivotal $1.00 demand area and, on the topside, the initial recovery hurdle at the SuperTrend barrier around $1.19. A daily close above this level would be needed to ease immediate selling pressure, exposing the 50-day EMA at $1.26 and the nearby descending trendline resistance at $1.27 as the next caps.
Further up, the 100-day EMA near $1.29 and the 200-day EMA around $1.34 compose a broader medium-term resistance band that would likely limit any rebound, keeping the overall structure bearish as long as XRP trades below this cluster.
(The technical analysis of this story was written with the help of an AI tool. Know more.)
Cryptocurrency metrics FAQs
The developer or creator of each cryptocurrency decides on the total number of tokens that can be minted or issued. Only a certain number of these assets can be minted by mining, staking or other mechanisms. This is defined by the algorithm of the underlying blockchain technology. On the other hand, circulating supply can also be decreased via actions such as burning tokens, or mistakenly sending assets to addresses of other incompatible blockchains.
Market capitalization is the result of multiplying the circulating supply of a certain asset by the asset’s current market value.
Trading volume refers to the total number of tokens for a specific asset that has been transacted or exchanged between buyers and sellers within set trading hours, for example, 24 hours. It is used to gauge market sentiment, this metric combines all volumes on centralized exchanges and decentralized exchanges. Increasing trading volume often denotes the demand for a certain asset as more people are buying and selling the cryptocurrency.
Funding rates are a concept designed to encourage traders to take positions and ensure perpetual contract prices match spot markets. It defines a mechanism by exchanges to ensure that future prices and index prices periodic payments regularly converge. When the funding rate is positive, the price of the perpetual contract is higher than the mark price. This means traders who are bullish and have opened long positions pay traders who are in short positions. On the other hand, a negative funding rate means perpetual prices are below the mark price, and hence traders with short positions pay traders who have opened long positions.
Nothing in this material constitutes investment advice, personal recommendation, investment research, an offer, or a solicitation to buy or sell any financial instrument. The content has been prepared without consideration of your individual investment objectives, financial situation, or needs, and should not be treated as such.
Past performance is not a reliable indicator of future performance and/or results. Forward-looking scenarios or forecasts are not a guarantee of future performance. Actual results may differ materially from those anticipated.
Mitrade makes no representation or warranty as to the accuracy or completeness of the information provided and accepts no liability for any loss arising from reliance on such information.
Recommended Articles


