



Home Depot Stock Sits on $344.31 Support After a Nearly 20% Run Into Earnings
TradingKey - Home Depot (NYSE: HD) reports fiscal third-quarter results on Tuesday, November 17, before the market opens. The home improvement retailer goes into the report trading on the lower edge of the rising channel that has carried the stock higher since early October, with $344.31 support just below.
The stock rose 19.5% from October 13 to November 11, while the S&P 500 fell over the same period. That rebound came after a 28.1% slide from February 13 to October 5, and the stock still trades about 12% below its 52-week high of $397.63.
A Rally the Housing Data Has Not Confirmed
In August, management said homes have changed hands at very low levels for four years, with no clear sign yet of an inflection point, and that big-ticket discretionary projects remain under pressure. Fewer home sales usually mean fewer large remodeling projects, a key source of Home Depot's sales. Customer transactions fell 0.8% in the second quarter, and analysts expect them to fall again in the third.
Even so, the stock gained almost 20% in a month, and Lowe's rose 22.2%. Yet the Zacks consensus EPS estimate for the third quarter was trimmed 0.2% over the past 30 days, so the move came from investors paying more for the same earnings, not from higher forecasts.
What Analysts Expect on Tuesday
Zacks consensus calls for revenue of $42.72 billion, up 3.3%, and adjusted EPS of $3.87, up 3.5% from $3.74. Adjusted EPS leaves out some acquisition-related costs. Analysts expect about 391.0 million customer transactions, down from 393.5 million, and an average ticket of $92.24, up from $90.39, meaning shoppers would visit less often but spend more per visit.
The second quarter followed the same pattern. Net sales rose 5.7% to $47.9 billion, comparable sales, which compare stores open at least a year, rose 1.7%, and adjusted EPS rose 5.1% to $4.92. The average ticket climbed 2.8% to $92.50, transactions over $1,000 rose 2.4%, and sales to professional contractors outpaced do-it-yourself shoppers.
Guidance and Valuation Set the Bar
Home Depot reaffirmed its fiscal 2026 outlook in August: total sales growth of about 2.5% to 4.5%, comparable sales flat to up 2.0%, and adjusted EPS flat to up 4% from $14.69, or about $14.69 to $15.28 by my calculation. It expects a gross margin, the share of sales left after the cost of goods, of about 33.1%, and said tariff refunds should partly offset unplanned fuel, energy and other input costs.
After the rally, Zacks puts the stock at 22.27 times forward earnings, above its five-year median of 21.78 times and Lowe's at 18.05 times. At that price, Tuesday's report needs to show steady comparable sales and no cut to guidance.
Home Depot Technical Analysis: 4-Hour Close Below $344.31 Could Open $330.65
That test shows clearly on the 4-hour chart. Since early October, Home Depot has climbed cleanly inside a rising channel, two parallel lines that have guided prices higher, moving from below $290 to a high near $362.18. Price is now sitting right on the lower edge of that channel, just above $344.31 support, which makes this a key moment for the uptrend before Tuesday's results. An earnings marker on the chart also points to volatility ahead.
RSI, a momentum gauge that runs from 0 to 100, has cooled to about 60 and slipped below its signal line. The MACD, another momentum indicator, has slipped below its signal line while staying above zero, which shows upside momentum is fading.
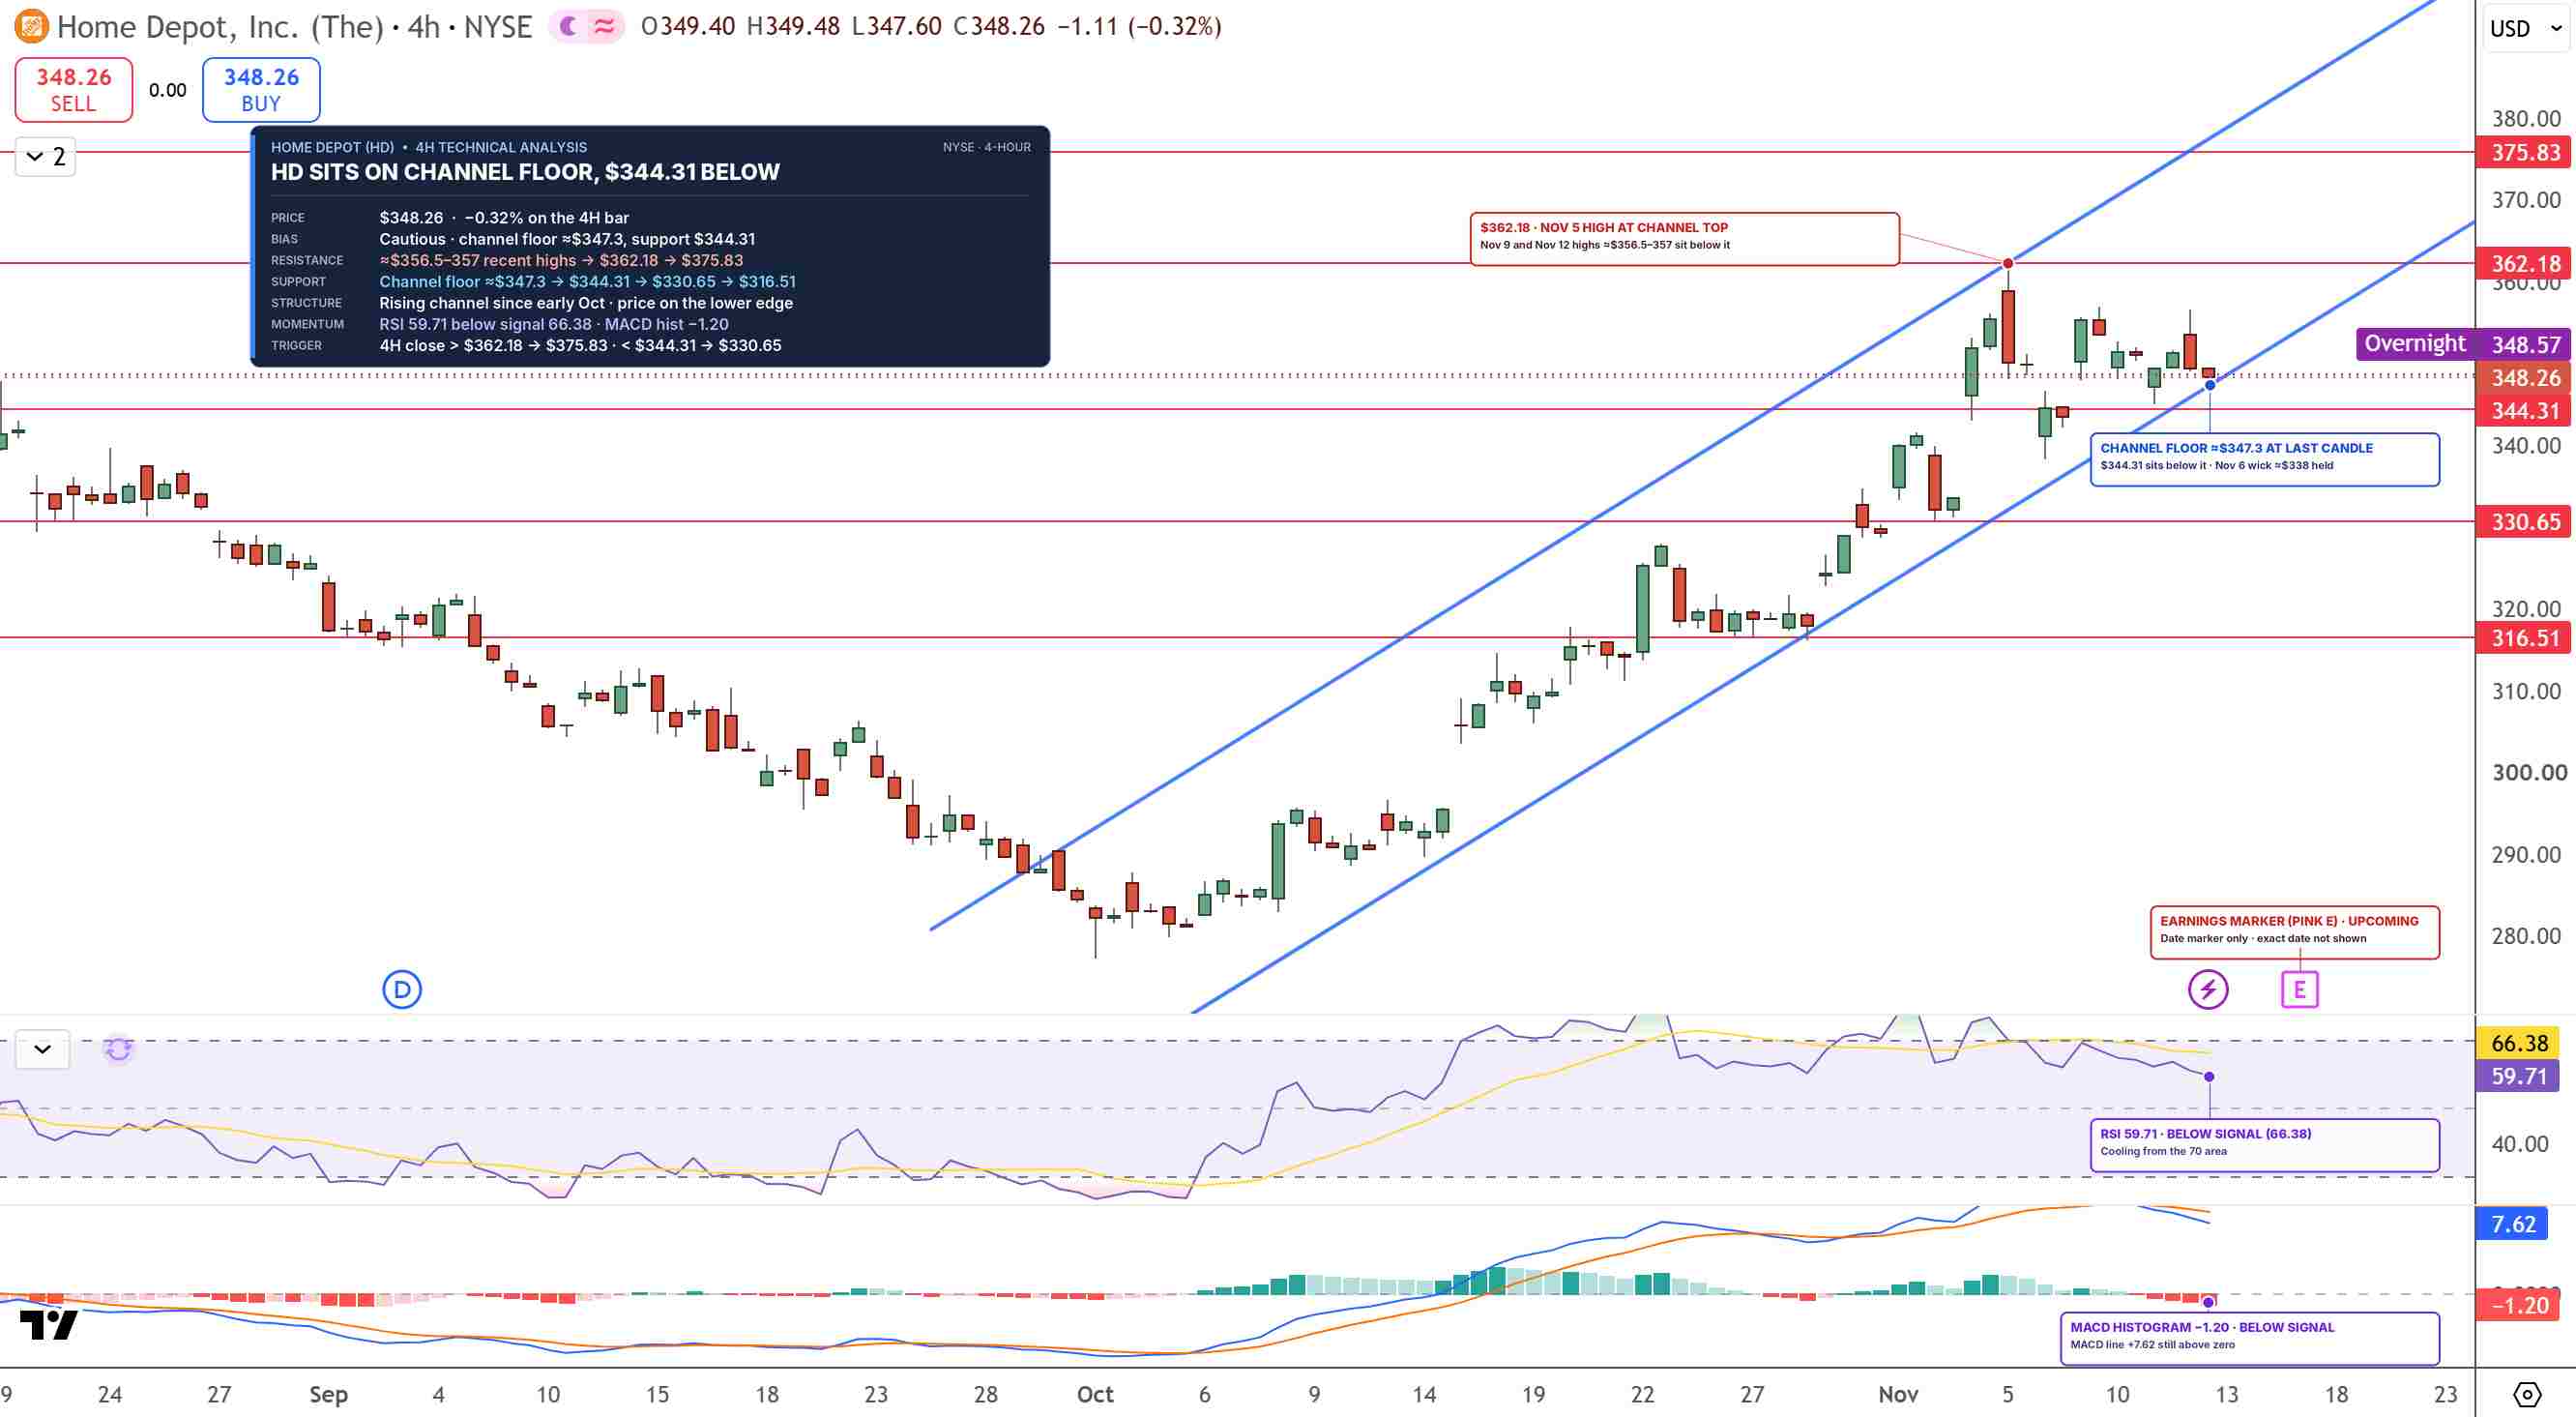
HD Price Chart - Source: Tradingview
If buyers hold this area, a 4-hour close above $362.18 could open $375.83. A close below $344.31, however, would break the channel and could send HD toward $330.65, followed by $316.51.
I'm cautiously bullish while HD holds above $344.31, and a break below that level would shift the outlook bearish.
Key Levels
- Last close: $348.26 on Thursday, November 12 (overnight: $348.57)
- Support: $344.31, $330.65, $316.51
- Resistance: $362.18, $375.83
- RSI: 59.71
- Bullish trigger: 4-hour close above $362.18
- Bearish trigger: 4-hour close below $344.31
FAQs
When does Home Depot report Q3 2026 earnings?
Home Depot reports fiscal third-quarter results on Tuesday, November 17, before the market opens. Analysts expect adjusted EPS of $3.87 on revenue of $42.72 billion.
What is the Home Depot stock forecast before earnings?
The bias is cautiously bullish while HD holds above $344.31, just below the lower edge of its rising channel. A 4-hour close above $362.18 could open $375.83, while a close below $344.31 could send the stock toward $330.65.
Bottom Line
Home Depot rallied without better housing data, and Tuesday's report has to back up a valuation above its five-year average. The level that matters is $344.31. In my view, holding it keeps the channel and a move toward $362.18 intact, while a 4-hour close below it would turn the outlook bearish ahead of the results.
Nothing in this material constitutes investment advice, personal recommendation, investment research, an offer, or a solicitation to buy or sell any financial instrument. The content has been prepared without consideration of your individual investment objectives, financial situation, or needs, and should not be treated as such.
Past performance is not a reliable indicator of future performance and/or results. Forward-looking scenarios or forecasts are not a guarantee of future performance. Actual results may differ materially from those anticipated.
Mitrade makes no representation or warranty as to the accuracy or completeness of the information provided and accepts no liability for any loss arising from reliance on such information.
Recommended Articles


