



Bank of America (BAC) Q2 2026: $9.1B Profit, 50% IB Fee Jump, Trading Up 33%; What’s Stopping $63?
TradingKey - Trading around $61.82, Bank of America (NYSE: BAC) surged after surpassing the $59.87 to $60.51 resistance band, fueled by July 14 Q2 2026 earnings that outpaced every major metric. Net profit climbed to $9.1 billion, reflecting a 27% increase from the $7.2 billion recorded in the same period last year. The company delivered earnings per share (EPS) of $1.21, topping the $1.13 projection by 7.7%. Revenue came in at $31.56 billion, a 15% annual gain and 2.6% above forecasts. Trading revenue was a standout performer at $7.2 billion, jumping 33% and securing the 17th straight quarter of positive growth.
Meanwhile, investment banking fees climbed 50% year-over-year to exceed $2.1 billion. Net interest income (NII) grew 9% to $16.0 billion, landing marginally short of the $16.2 billion consensus. The bank also bought back $6 billion in stock. The RSI is sitting close to 71. The first hurdle stands at $61.98, with $62.70 and $63.45 next on the radar.
Q2 Earnings: The 27% Net Income Surge Explained
BofA’s Q2 2026 numbers were primarily powered by its Markets unit. Net income in the Global Markets segment reached $2.7 billion, a massive 70% jump year-over-year. Sales and trading revenue of $7.2 billion (up 33%) marked the 17th straight quarter of gains for that division, the longest streak in over four years without a single quarterly decline. That consistency isn’t the work of a unique market environment; it shows BofA has built an improved trading franchise and risk controls on equity and fixed-income products. Investment banking fees (up 50% YoY, to more than $2.1 billion) were a second sign that the capital markets environment in Q2 was healthy across M&A, equity issuance and debt capital markets.
The Q2 shortfall was NII (at $16.0 billion vs. the $16.2 billion expected), the gap between what BofA earns on loans/investments and what it pays depositors. That roughly $200 million miss mirrors the same rate headwind JPMorgan flagged Tuesday, lower rates on floating-rate assets shrinking margins faster than fixed-rate assets can reprice to compensate. Average loans climbed 8% YoY to $1.2 trillion, and average deposits rose 2.5% to $2.02 trillion—the volume picture is solid. The margin is under some incremental pressure. But consider that BofA’s efficiency ratio was 59% (better than the 59.8% estimate), so BofA is pulling in more revenue for each dollar of expense than Wall Street expected, partially offsetting the NII miss for the bottom line.
Seventeen Consecutive Quarters of Trading Growth; Why This Matters for the Stock
BofA’s 17th consecutive quarter of trading growth carries a lot of analytical weight, since it started well before this AI-driven capital markets cycle. The streak kicked off in 2022, and includes the Fed’s rate-hike cycle, the bond market melt-down in 2022, 2023’s regional banking crisis, and the 2024-2026 AI-capex boom. And yet each of those environments brought different asset allocations, volatility patterns and client risk tolerances. BofA’s sales and trading revenue grew through all of them, pointing to a more fundamental shift, on client coverage, market-making capacity and tech platforms, than a cyclical bounce-back. A 33% YoY gain in Q2 2026, while markets were anything but volatile, makes the argument stronger.
The $6 billion buyback in Q2 shows BofA is willing to return capital. At 11.2% its CET1 capital ratio sits comfortably above required capital levels, and with nearly $202 billion in common equity Tier 1 capital. The firm’s management signaled confidence that it can handle Basel III’s capital-rule changes (which JPMorgan flagged on Tuesday) without throttling returns. CEO Brian Moynihan also pointed on the July 14 call to a H2 2026 rebound in NII on account of fixed-rate loans repricing higher. If the bank sees NII climb for H2, then the Q2 miss will be more of a timing issue than a trend issue.
BAC Technical Analysis: Breakout Above $60.51, RSI 71, Key Levels
On the 4-hour, BAC at $61.82 is above the $59.87-$60.51 resistance that it recently turned into support, and above the 50-period EMA ($59.30). RSI is getting close to 71 and nearing overbought levels; short consolidation at these prices before the next leg is a possibility. Resistance sits at $61.98.
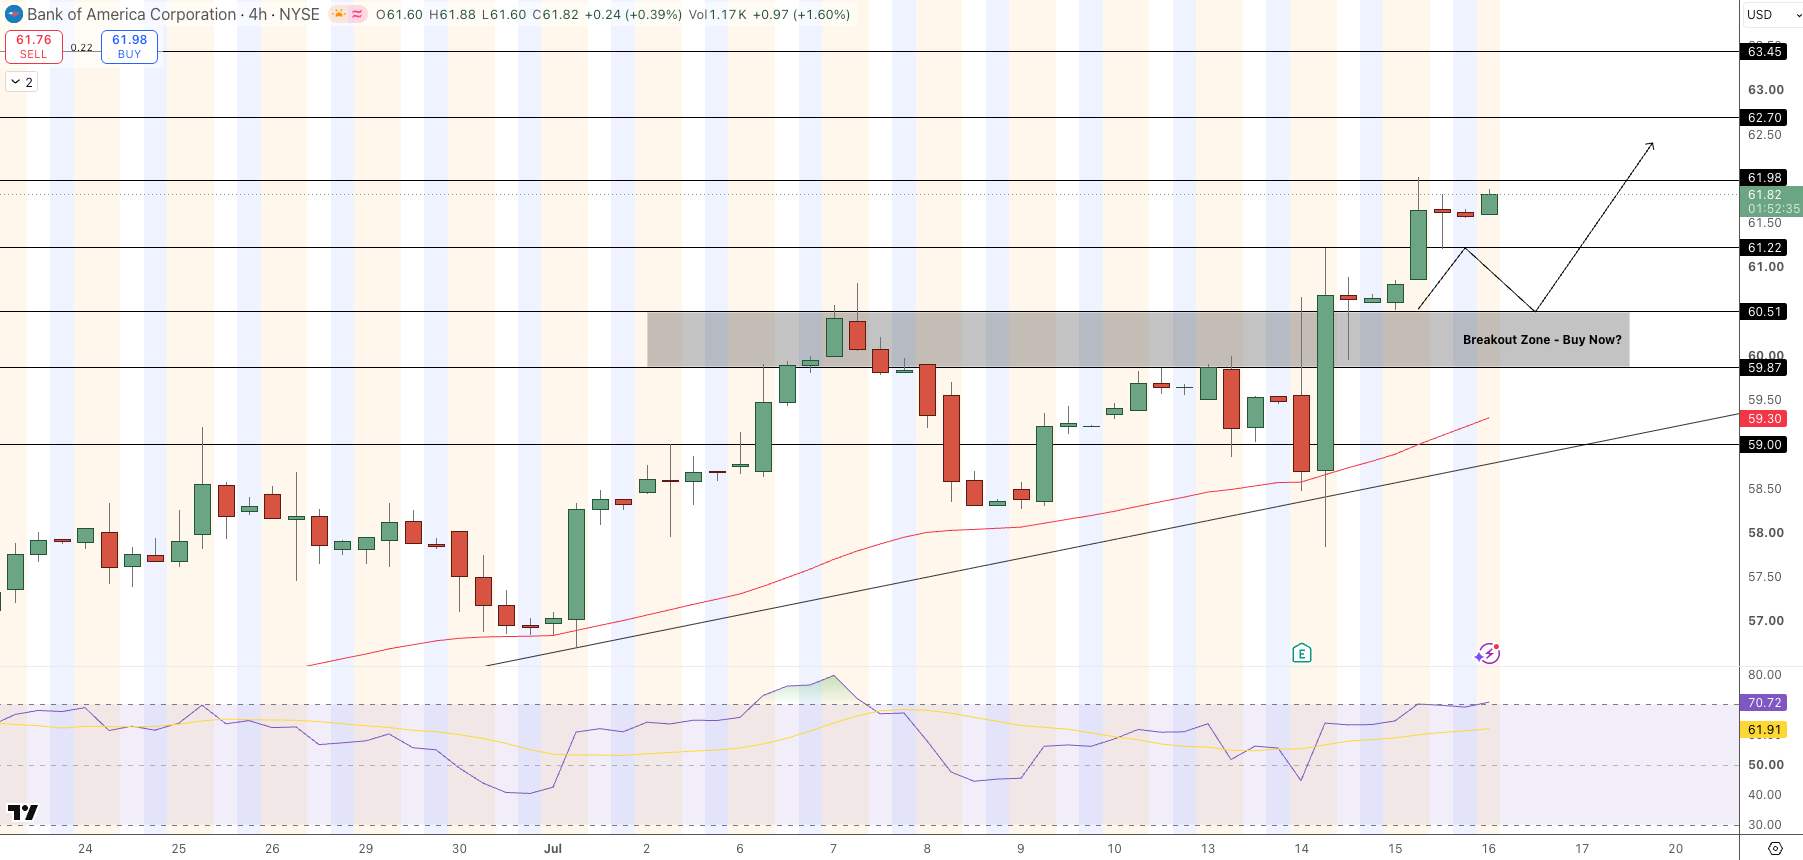
Bank of America (BAC) Price Chart - Source: Tradingview
A break of it leads to $62.70 and $63.45. A pullback to $60.51 on the uptrend could be a retest chance, while a close below $59.87 weakens the breakout structure.
- EPS: $1.21 vs. $1.13 consensus (+7.7%), or a 34% improvement over the $0.90 EPS in the Q2 2025
- Revenue: $31.56B (+15% YoY), +2.6% above estimates.
- Trading: $7.2B for sales & trading (+33% YoY). The 17th straight quarter of growth.
- IB fees: > $2.1B (up 50% YoY). Buybacks: $6B in Q2.
- NII: $16B (up 9% YoY), slightly under the $16.2B estimate. CEO hints it will improve in the second half.
- Resistance: $61.98, $62.70, and $63.45. Support: $60.51 breakout area.
What Were Bank of America’s Q2 2026 Earnings Results?
Bank of America (NYSE: BAC) reported earnings for the second quarter of 2026 on the 14th of July. Net income in Q2 2026 was $9.1 billion, a 27% increase from $7.2 billion in Q2 2025. Diluted earnings per share were $1.21, which beat estimates of $1.13 by 7.7%. It increased from $0.90 over the past year.
Bank of America’s Q2 2026 revenue was $31.56 billion, a 15% increase year on year and 2.6% above estimates. It grew 33% year on year. Bank of America’s sales and trading revenue increased by 33% from the same period in Q2 2025 and marks the 17th quarter of consecutive growth.
Bank of America’s investment banking fees increased 50% from the same period in the past year to over $2.1 billion. Q2 2026 net interest income was $16.0 billion, a 9% increase year on year, however it came slightly below the Q2 2026 estimate of $16.2 billion. Bank of America bought back $6 billion in stock and it has an ordinary bank stock ratio (CET1) of 11.2%.
Why Did Bank of America’s NII Miss the Estimate?
Bank of America (NYSE: BAC)’s net interest income (NII) in the second quarter of 2026 (Q2 2026) was $16.0 billion, which was $200 million below the consensus estimate of $16.2 billion. Net interest income (NII) represents the spread between earnings on loans and other investments that Bank of America generates against the amount it pays out to depositors.
Net interest income fell due to the compression caused by lower rates on variable-rate loans and investments, and JPMorgan also reported similar trends in its second quarter 2026 report released on the 14th of July. The volume story is healthy with average loan volumes growing 8% year on year and deposit volumes growing 2.5%. During an analysts conference call, Brian Moynihan, the Chief Executive Officer of Bank of America said it is BofA’s expectation that net interest income will trend higher in the second half of 2026 as fixed-rate assets start to reprice at more attractive yields. This implies that Q2 2026 is a matter of timing and the company is anticipating NII to recover in the remaining two quarters of the year.
What Is Driving Bank of America’s 17-Quarter Trading Growth Streak?
Sales and trading revenues have been growing for 17 quarters in a row for Bank of America (NYSE: BAC). It started at the height of the Federal Reserve rate hike cycle and included the 2022 bond market selloff and the Bank of America, the 2023 banking crisis, and it has now extended into the AI infrastructure investment wave.
The Q2 2026 sales and trading growth was 33% year on year, in an environment that was not especially volatile which implies that the improvement is more structural in nature, driven by Bank of America’s improved coverage of clients, market-making capacity, and technology. The bottom line is Bank of America’s second quarter 2026 Global Markets net income grew 70% year on year and is up to $2.7 billion.
Bottom Line
Bank of America (NYSE: BAC) had second quarter earnings per share of $1.21, above estimates by 7.7%, on $31.56 billion in revenue growing by 15% year on year. Net income of $9.1 billion increased by 27% compared to the same period a year earlier. Bank of America’s trading revenues rose by 33% to achieve its 17th consecutive quarter of growth. Investment banking fees increased 50%. Bank of America (NYSE: BAC) Q2 2026 net interest income was $16.0 billion, slightly below the estimate but management expects an increase in the second half. Bank of America (BAC) is at $61.82, above the $60.51 breakout zone with RSI close to 71. A close above $61.98 targets $62.70 then $63.45. A drop to $60.51 that holds would be a retest of the breakout zone within the uptrend. If BAC goes below $59.87, the breakout loses some strength.
Nothing in this material constitutes investment advice, personal recommendation, investment research, an offer, or a solicitation to buy or sell any financial instrument. The content has been prepared without consideration of your individual investment objectives, financial situation, or needs, and should not be treated as such.
Past performance is not a reliable indicator of future performance and/or results. Forward-looking scenarios or forecasts are not a guarantee of future performance. Actual results may differ materially from those anticipated.
Mitrade makes no representation or warranty as to the accuracy or completeness of the information provided and accepts no liability for any loss arising from reliance on such information.
Recommended Articles


