



SpaceX Beat Revenue at +92% and Reclaimed $135 IPO Price — Can SPCX Hold $154.36 Breakout?
TradingKey - SpaceX (SPCX) stock reclaimed its $135 IPO price, and has staged a powerful recovery to $146.24 following one of Wall Street's most volatile post-IPO stretches this year. SpaceX stock has broken out of a descending channel, retraced 50% of the price move with the prior key level of $139.04, and is currently targeting important resistance around $154.36. Q2 earnings showed 92% YoY company growth and impressive Starlink subscriber growth with 12 million subscribers (doubling last years growth), in addition to the company offering AI services that posted 250% YoY growth and $2.56B in revenue. There is a great deal of interest surrounding the possibility that Musk's AI services could be the largest revenue producing services for SpaceX by the end of September. For traders, a breakout above $154.36 would target $163.36 and $172.14 in the near-term. For investors, the August 20 lockup expiration leaves the question if the 92% growth, $14.1B contracted AI sales, and Starlink growth is real, or just a brief relief.
The Rebound: From Post-IPO Crash Back to IPO Price
SpaceX peaked around $225.64 in early June. After its $135 IPO, the stock crashed to ~$105.75 late July. Concerns with post-IPO valuations and finally the capital intensive growth spurred the post-IPO crash. The stock has recovered from the $105.75 level (38%) to $146.24, reclaiming the IPO price and breaking the descending linear channel.
The recovery structure is showing higher lows, price is above the 50% Fibonacci retracement at $139.04, and with an RSI of 67, there is room for price to go higher. The stock has broken key technical levels, demonstrating that institutions believe the bearish trend is losing strength.
Q2 Fundamentals: 92% Revenue Growth Across All Segments
SpaceX beat revenue expectations in Q2 2022 with $7.814 billion in reported revenue, a 92% increase from $4.1 billion in the same quarter last year. The consensus was closer to $6.9 billion. SpaceX grew all three of its business segments. Connectivity (Starlink) brought in $4.291 billion, growing 66% from last year. SpaceX's AI business brought in $2.5 billion, growing 250% from last year, and Space (launches and Starshield) generated $962 million. For the quarter, SpaceX reported $3.54 billion in adjusted EBITDA with a 63% margin and positive $1.22 billion free cash flow, a strong sign the business is profitable at this level of capital spending.
Starlink: 12M Subscribers Doubled YoY, 22M Via Mobile Partners
Starlink hit approximately 12 million subscribers of traditional broadband services, doubling last year's numbers. The company reported that its mobile partner network through wireless providers has extended to about 22 million subscribers. This new network allows SpaceX to better penetrate rural areas to offer a direct-to-cell satellite based mobile connectivity as a means to take customers from Verizon, AT&T and T-Mobile. This new strategy requires a significant amount of investments in spectrum, regulatory approvals and network deployments to compete in the mobile directly connectivity segment.
AI Is Becoming the New Growth Engine — But at Enormous Cost
The major new development since the release of Q2 earnings has been the rapid integration of AI technology. During the week of May 23rd, Musk reportedly told employees that by September all revenue streams at SpaceX will be dwarfed by AI as a primary vertical. The company also stated they have contracted $14.1 billion in cloud-based services and are aiming to have 10 gigawatts of AI-related compute capacity by 2027.
The investment numbers behind this are even more staggering. For the second quarter, SpaceX spent $18.4 billion total on capital expenditures (capex), and of that number $15.83 billion was on AI-related infrastructure. At what point will the company will run out of cash to support these initiatives? With positive free cash flow of $1.22 billion for the quarter, the current answer to this question is “not yet”; however these investments will require sustained revenue streams, revenue in particular from Starlink, to offset the associated risks of these high capital investments.
Government Contracts Add Recurring Revenue Diversification
SpaceX shared details of the over $6 billion worth of contracts, spanning numerous launches, secure launch communications, and delivery of the Starlink systems. Contracts of this nature minimize the company’s revenue exposure from consumer-based and launch cycle services. These contracts create a virtually impenetrable barrier for competitors as very few can go as vertically integrated as SpaceX.
SpaceX Technical Setup: Cleared Channel, Testing $154.36 Breakout
On the 4-hour chart, SpaceX has recorded strong bullish reversal following a clean escape from a descending channel. The recovery from the support at $105.75 has cleared the 50% Fibonacci retracement level of $139.04 and is currently trading at the 61.8% Fibonacci retracement level at $146.85. The next relevant level will be the $146.85 - $154.36 zone.
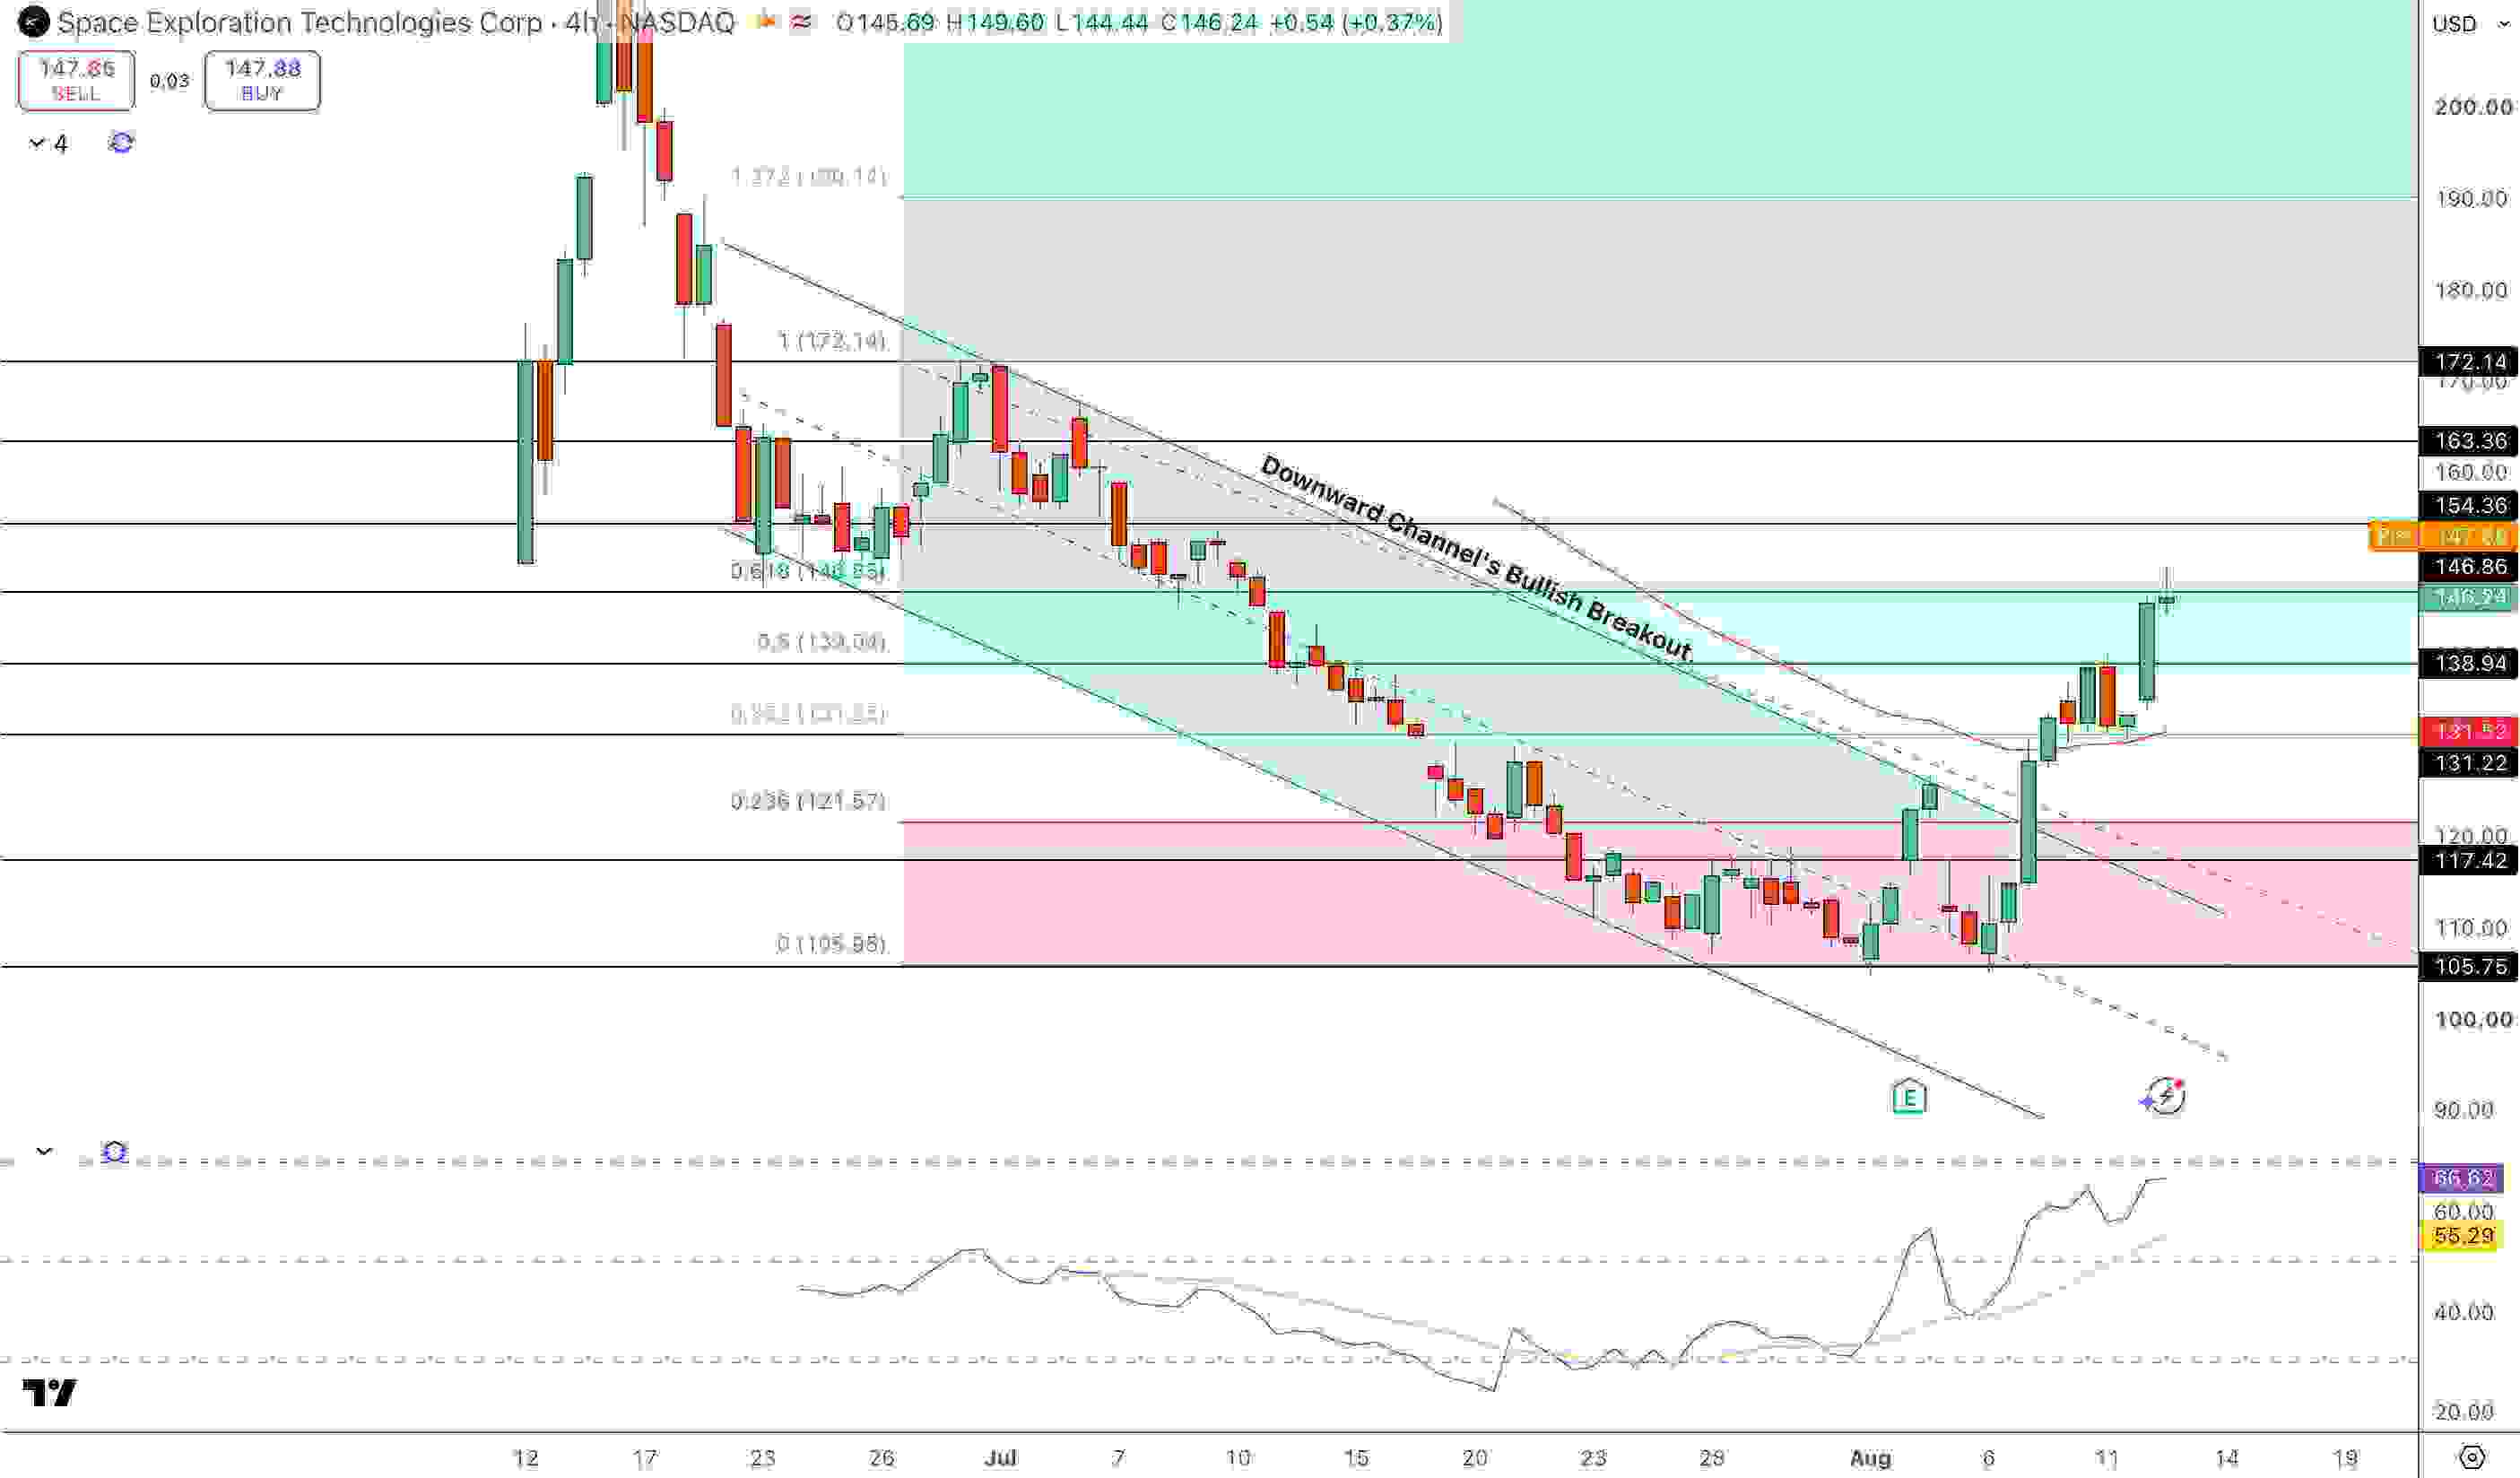
SPCX Price Chart - Source: Tradingview
Above $154.36 there is a strong likelihood of additional gains in the reversal. The RSI is currently at 67 and is above its signal line at 55, and is positioned at an area of overbought, highlighting considerable buying pressure. However, the rapid advance increases the probability of a minor pause. Below $154.36, the next important support level is $139.04 with a stronger support zone of $131.52 - $131.23.
Key Levels (Aug 13)
- Immediate resistance: $146.85 (61.8% Fibonacci)
- Key breakout level: $154.36 (critical test)
- Extended targets: $163.36, $172.14 (if breakout holds)
- First support: $139.04 (50% Fibonacci)
- Support cluster: $131.52, $131.23
- Deeper support: $121.57 (Fibonacci)
- Current price: $146.24 (inside breakout zone)
- RSI: 67 (strong momentum, near overbought)
The Lockup Risk Remains on August 20
Around 20 August, further tranches of post-IPO shares will be eligible for trading. The first lockup expiry (6 August) saw the release of approximately 911.5 million shares to the market which was absorbed fairly well. Ongoing share unlocks could create pressure on valuation, particularly if employees and early investors who have large unrealized gains decide to sell. This continues to be a near-term technical risk, irrespective of trading performance.
The Bottom Line
Since the SpaceX post initial public offering (IPO) crash lows, the stock has recovered to the $135 IPO price at $146.24. From a fundamental perspective, the second quarter revenue increased by 92%, Starlink has 12 million traditional subscribers and 22 million from mobile partners (both over doubled from the previous year), SpaceX's artificial intelligence (AI) revenue is estimated to be $2.56 billion and has grown 250% over the last year, and the company has contracted sales of $14.1 billion. Even with large AI capex estimated at $15.83 billion for the quarter, free cash flow is positive at $1.22 billion.
From a technical perspective, SPCX has cleared the descending channel and the 50% Fibonacci at $139.04. Currently, SPCX is testing the breakout level of $154.36. RSI at 67 is supportive and strong, but approaching overbought, so there is potential to continue moving up should the level of $154.36 be broken. A close above $154.36 would be targeted at the $163 - $172 range. Support at $139.04 must hold on any pullback.
For tactical traders: $154.36 is a key confirmation level. If that level breaks, $163-172 becomes a possible target. For investors: the 92% growth, $14.1B contracted AI sales, and Starlink scaling are all reasons to invest at crash lows. However, the August 20 lockup expiration is a risk. Trade above $154.36 with the expectation to take profits above $163-172. Volatility around the lockup date is an expected risk. This is analysis, not investment advice.
Nothing in this material constitutes investment advice, personal recommendation, investment research, an offer, or a solicitation to buy or sell any financial instrument. The content has been prepared without consideration of your individual investment objectives, financial situation, or needs, and should not be treated as such.
Past performance is not a reliable indicator of future performance and/or results. Forward-looking scenarios or forecasts are not a guarantee of future performance. Actual results may differ materially from those anticipated.
Mitrade makes no representation or warranty as to the accuracy or completeness of the information provided and accepts no liability for any loss arising from reliance on such information.
Recommended Articles


