



Micron Stock Price Forecast: Morgan Stanley and UBS Both Boost Holdings in 13F Filings, Strong Buy Consensus, Could Stock Return to $1,000?
TradingKey - As U.S. 13F filings have been released recently, second-quarter position reports from Wall Street investment banks such as Morgan Stanley and UBS have been successively disclosed. Notably, in the disclosed reports, Micron (MU) became one of the top five holdings increased by both investment banks.
According to disclosures by the U.S. Securities and Exchange Commission (SEC), Morgan Stanley's total portfolio market value reached $1.89 trillion in the second quarter, up 13.9% quarter-on-quarter. In its portfolio, it added 449 new stocks, increased holdings in 3,850 stocks, reduced holdings in 3,280 stocks, and completely exited 334 stocks.
Notably, judging from changes in holding proportions, the top five increased holdings during the period were concentrated in the semiconductor sector, namely Micron Technology, AMD, Intel, Applied Materials, and Lam Research.
UBS's total portfolio market value reached $790 billion in the second quarter, up 18% quarter-on-quarter. In its portfolio, it added 1,281 new stocks, increased holdings in 4,272 stocks, reduced holdings in 4,416 stocks, and completely exited 1,282 stocks.
The top five bought assets were Eli Lilly call options, S&P 500 ETF put options, Micron Technology, Micron Technology call options, and Nasdaq 100 ETF call options.
Currently, several Wall Street investment banks are highly optimistic about Micron's prospects, giving an overall consensus rating of "Strong Buy". Over the past 3 months, a total of 30 analysts have rated Micron Technology, with the highest target price at $2,200, offering about 125% upside from the current level of around $980; the lowest target price is $1,100, which also implies about 12% upside. The average target price is $1,569.07.
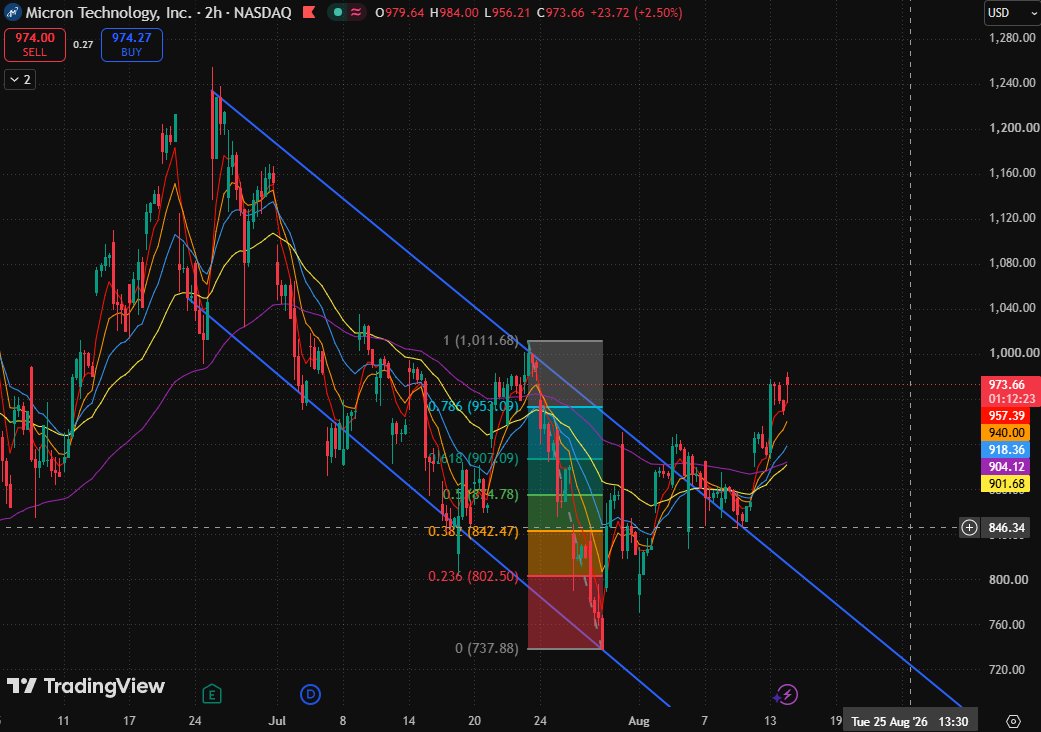
Micron 2-hour stock price chart, Source: TradingView
Micron's stock price has broken above the previous downward trendline and reclaimed the 5-day, 10-day, 20-day, 40-day, and 80-day moving averages, significantly improving its short-term structure. As the price reclaims the 0.786 Fibonacci retracement level ($953.30), the current movement has shifted from a low-level recovery to testing a rally back toward previous highs.
Regarding moving averages, the 5-day and 10-day moving averages are accelerating upward, while the 20-day, 40-day, and 80-day moving averages have all turned into support below the stock price. Meanwhile, the price breakout above the long-term downward trendline indicates that the previous bearish pressure is easing.
Primary short-term support has moved up to the 0.786 Fibonacci retracement level ($953.30), which also serves as a key retest confirmation zone after breaking above the downward trendline. If support holds after the retest, the current upward structure is expected to continue. Upside potential will open up toward the previous high ($1,011.68) to the 1.272 Fibonacci extension level ($1,085.38).
If the stock price falls back below the 0.786 Fibonacci retracement level ($953.30) and fails to quickly reclaim it, the validity of the trendline breakout will be called into question, and the pullback may extend toward $907.09.
Only if the stock price holds firmly above $953.30 and achieves a further effective breakout above $1,011.68 can it more strongly confirm that this move has shifted from a rebound recovery to a medium-term trend improvement.
Nothing in this material constitutes investment advice, personal recommendation, investment research, an offer, or a solicitation to buy or sell any financial instrument. The content has been prepared without consideration of your individual investment objectives, financial situation, or needs, and should not be treated as such.
Past performance is not a reliable indicator of future performance and/or results. Forward-looking scenarios or forecasts are not a guarantee of future performance. Actual results may differ materially from those anticipated.
Mitrade makes no representation or warranty as to the accuracy or completeness of the information provided and accepts no liability for any loss arising from reliance on such information.
Recommended Articles


