



Spotify Stock Forecast: Subscriber Beat Lifts SPOT 11% Above $565.39 as Chip Stocks Slide
TradingKey - Spotify Technology (NYSE: SPOT) stock price jumped 11.10% to $583.66 on Thursday, October 22. Most of the buying was triggered after reporting third-quarter results before the open. But overnight quotes eased slightly to $579.72. The gain came on a day the Nasdaq Composite fell 2.60% and the Philadelphia Semiconductor Index, a widely followed chip-stock benchmark, dropped 6.72%.
Spotify beat its own subscriber target and guided to about 10 million new subscribers in Q4. As investors sold AI-linked stocks, buyers instead flocked to a profitable subscription business with €9.9 billion in cash.
Q3: Subscribers Beat, Revenue in Line
Premium subscribers, the users who pay for the service, rose 9% to 306 million, one million above guidance. Monthly active users, which include free listeners, grew 11% to 788 million, in line with the target. Revenue rose 16% to €4.97 billion, or 14% at constant currency, matching the roughly €5.0 billion guide.
Gross margin reached 33.0%, a third-quarter record and 136 basis points, or 1.36 percentage points, higher than a year earlier. Operating income, the profit from running the business, rose 15% to €672 million, just above the €670 million guide. That came even though social charges, payroll taxes that rise with the share price, ran €13 million above forecast.
The EPS Miss Came From Below the Operating Line
Diluted EPS of €2.48 missed the roughly €2.80 consensus, and net income fell to €518 million from €899 million. The gap came from items outside day-to-day operations. A year earlier, Spotify booked €262 million of finance income and a €72 million tax benefit, while this quarter it recorded €62 million of finance income and €187 million of tax expense. With operating income above guidance, investors looked past the miss.
Q4 Guide Calls for 10 Million New Subscribers
Spotify guided Q4 to 316 million premium subscribers, about 10 million net additions, meaning new subscribers minus cancellations. It expects 818 million monthly users, about 30 million net additions after 11 million in Q3. Revenue is guided to €5.2 billion, including about 2.3 percentage points of help from currency moves, with gross margin of 33.8% and operating income of €820 million.
Audiobooks are expanding from 22 markets to more than 180 by year-end, and Spotify now works inside Muse, Meta's AI agent.
Price Increases Lift Premium Revenue
Premium revenue rose 17% to €4.49 billion as the subscriber base grew and each subscriber paid more on average. Average revenue per subscriber climbed 9.3% to €4.95, helped by price increases. Ad-supported revenue grew 10% to €482 million, and CFO Christian Luiga said Spotify expects to "continue our progress towards double-digit growth" in Q4.
Spending Rises, Cash Stays Strong
Operating expenses rose 26%, or 19% excluding currency moves and social charges, on marketing and cloud and AI costs that Spotify calls temporarily elevated. Free cash flow, the cash left after operating costs and capital spending, fell 9% to €735 million. Even so, Spotify holds €9.9 billion in cash and short-term investments and has bought back $1.1 billion of its own shares this year through October 21.
Analysts Split After the Jump
StoneX downgraded the stock to Hold, saying optimism may already be priced in, and Piper Sandler started coverage at Neutral with a $540 target. Across 35 brokerages, 24 rate it Buy or better, and the average target of about $606.94 sits just below the $609.13 chart resistance.
Spotify Technical Analysis: Daily Close Above $609.13 Could Open $639.51
On the daily chart, SPOT gapped higher at the open and closed above the $565.39 resistance zone, a level that rejected rallies twice in September, for its highest close since December. The session low at $555.32 dipped back into that zone before buyers pushed price to a near-high close, so demand absorbed the early selling. Price sits well above both moving averages, at $517.94 and $511.59, and the rising channel from the spring lows, two parallel lines containing the uptrend, is intact.
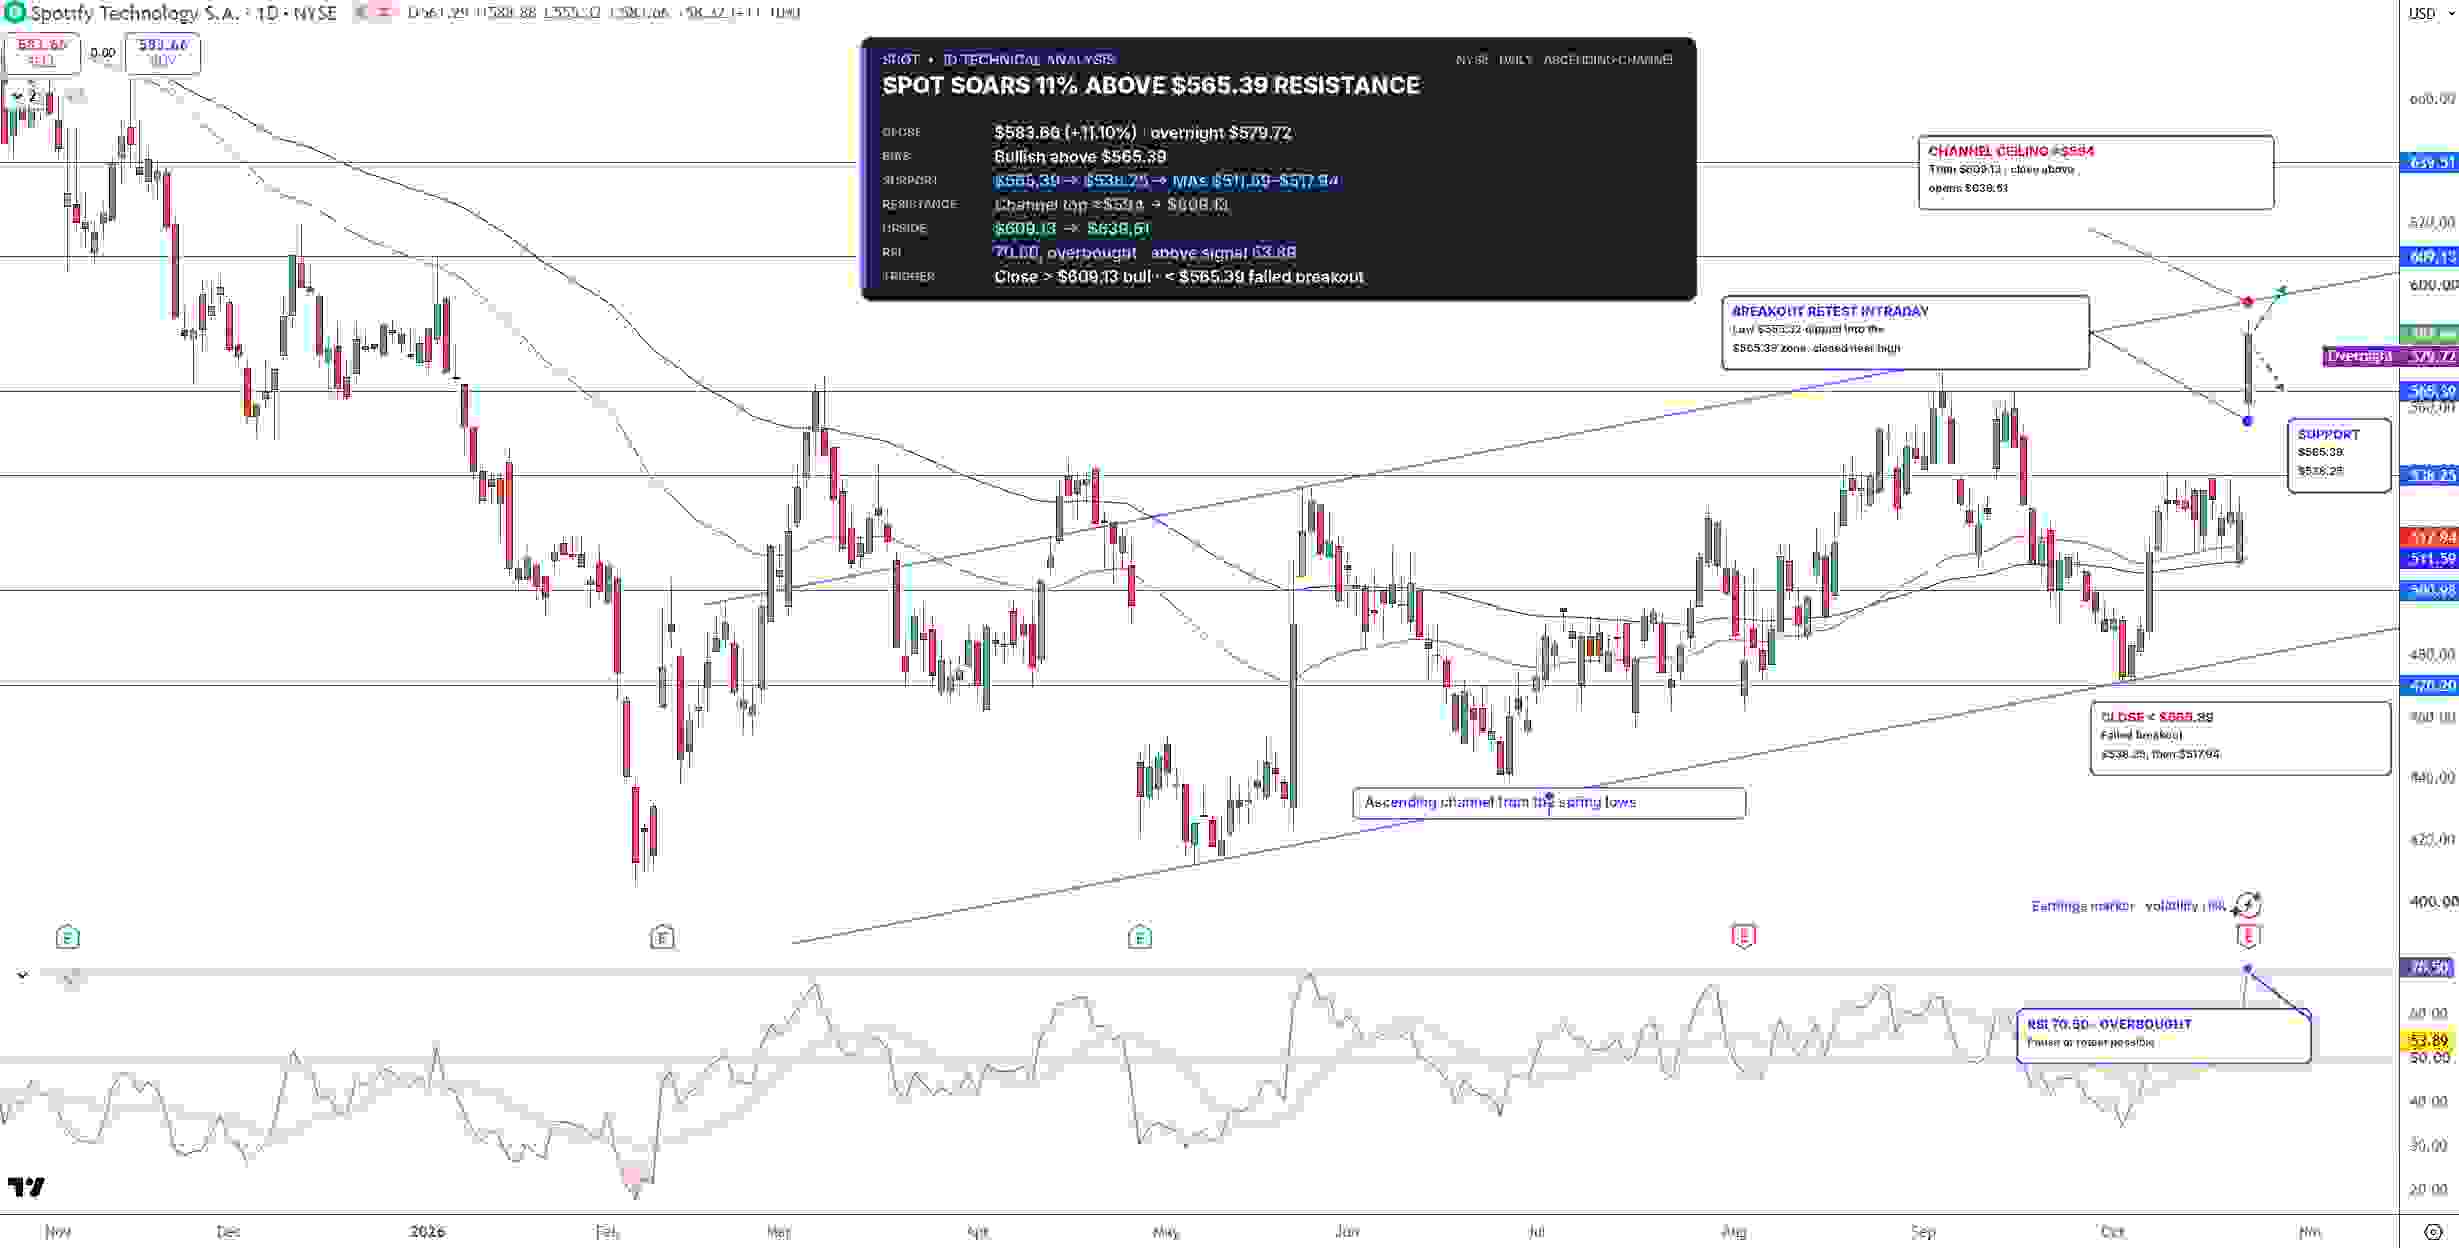
Spotify Stock Price Chart - Source: Tradingview
RSI, a momentum gauge that runs from 0 to 100, sits just over 70, above its signal line. Readings above 70 count as overbought, and after a gap this large, they often bring a pause or a retest, where price returns to old resistance to check whether it now holds as support.
The next hurdle is the channel ceiling near $595, then $609.13. A daily close above $609.13 would open the way for $639.51. A close back below $565.39 would mean a failed breakout and open the way for $538.25.
I lean bullish while SPOT holds above $565.39, though overbought conditions could bring a short pause first.
Key Levels
- Last close: $583.66, up 11.10% on October 22
- Support: $565.39, $555.32, $538.25, $511.59 to $517.94
- Resistance: $595, $609.13, $639.51
- RSI: 70.50, above its 53.89 signal line
- Bullish trigger: Daily close above $609.13
- Bearish trigger: Daily close below $565.39
FAQs
Why did Spotify stock jump after Q3 earnings?
Spotify reached 306 million premium subscribers, one million above guidance, and guided to about 10 million net additions in Q4, ahead of analyst expectations. Investors looked past an EPS miss caused by lower finance income and higher taxes.
What is the Spotify stock forecast after earnings?
The bias is bullish above $565.39. A daily close above $609.13 targets $639.51, while a close below $565.39 opens $538.25.
Bottom Line
Spotify grew subscribers and margins without the heavy AI spending that hit chip stocks, but its Q4 target of 10 million net additions sets a high bar. The level that matters is $565.39, the old resistance. In my view, holding it keeps $609.13 in play, while a close back below it would turn the jump into a failed breakout.
Nothing in this material constitutes investment advice, personal recommendation, investment research, an offer, or a solicitation to buy or sell any financial instrument. The content has been prepared without consideration of your individual investment objectives, financial situation, or needs, and should not be treated as such.
Past performance is not a reliable indicator of future performance and/or results. Forward-looking scenarios or forecasts are not a guarantee of future performance. Actual results may differ materially from those anticipated.
Mitrade makes no representation or warranty as to the accuracy or completeness of the information provided and accepts no liability for any loss arising from reliance on such information.
Recommended Articles


