



Western Digital Stock Forecast: Guidance Beat Can't Stop WDC's Slide Toward $331.30 Support
TradingKey - Western Digital (NASDAQ: WDC) fell 6.43% to $354.19 on Thursday, October 22, as the AI and chip selloff hit storage stocks before its report. After the bell, the company beat estimates and guided far above consensus. Shares rose briefly, then reversed to $331.19 after hours, down 6.49%.
At Thursday's close, the stock sat about 56% below its 52-week high of $799.87. Strong results and a bigger guide could not offset two things: a market selling anything tied to AI spending, and a hint that Western Digital's own capex will run higher for two years.
Q1 FY2027: A Clean Beat
Revenue rose 55% to $4.38 billion, against about $4.14 billion expected. Adjusted EPS, which strips out items such as stock-based pay, jumped 161% to $4.64, above the roughly $4.10 estimate. Adjusted gross margin, the share of revenue left after production costs, reached 58.1%, up 14.2 percentage points from a year earlier, and adjusted operating margin hit 49.1%.
Cloud revenue, from drives sold mainly to large data center operators, rose 54% to $3.9 billion, or 88% of the total.
Exabyte shipments rose 22% to 248, where one exabyte equals a billion gigabytes of storage. Price per terabyte climbed 28% year over year, up from the high teens in the prior quarter, so Western Digital is selling more capacity and getting paid more for each unit of it.
Q2 Guidance Sits About 20% Above Consensus
For fiscal Q2, Western Digital guided revenue to $5.1 billion, plus or minus $100 million, against about $4.57 billion expected. That implies growth of 66% to 72%. Adjusted gross margin should reach 60% to 61%, and adjusted EPS $5.80, plus or minus $0.20, versus about $4.82 expected. The EPS midpoint is about 20% above consensus.
Capex Will Run Above Target for Two Years
The stock turned lower during the call. CFO Kris Sennesael said capex, the money spent on equipment and factories, should average 4% to 6% of revenue over five years but run modestly above that range for the next two. He said the money will go to heads and media for HAMR, a heat-assisted recording technology that packs more data onto each disk, and to factory automation, "and not to expanding our unit capacity."
Management also flagged rising DRAM and NAND costs. Spending on technology rather than new capacity should keep supply tight, and tight supply supports pricing. On a day dominated by fears over AI spending, though, investors sold first.
Demand Visibility Into 2031
CEO Irving Tan said Western Digital has visibility into storage demand from its seven biggest customers through 2030 and 2031, adding that "there has not been any diminishing in demand." Sennesael said there is room for price per terabyte growth to expand further over the next three to four quarters, though less of the outlook is covered by long-term agreements the further out it goes.
Cash Flow Funds Buybacks and a Higher Dividend
Free cash flow, the cash left after operating costs and capital spending, rose to $1.38 billion from $599 million. Western Digital bought back $1.0 billion of stock, raised its dividend 17% to $0.175 per share and spent $570 million settling convertible notes, bonds that can be swapped for shares.
Annualizing the Q2 EPS midpoint gives about $23 a share, so at the after-hours price the stock trades near 14 times that figure. Goldman Sachs kept a Neutral rating with a $615 target, saying investor expectations were already high.
Western Digital Technical Analysis: Daily Close Below $331.30 Could Open $296.61
On the daily chart, WDC has made lower highs since July beneath a falling trendline, a line drawn across those peaks, and a run of lower highs is the basic shape of a downtrend. It also trades below both moving averages, which track the average price over a set period, at $428.40 and $442.28. After hours, price dipped to $331.19, just below $331.30 support, a level where buying has stopped declines before. The overnight bounce to $345.51 shows buyers are still defending that floor for now.
RSI, a momentum gauge that runs from 0 to 100, is near 38. Momentum is weak, but the reading is still above 30, the usual oversold line.
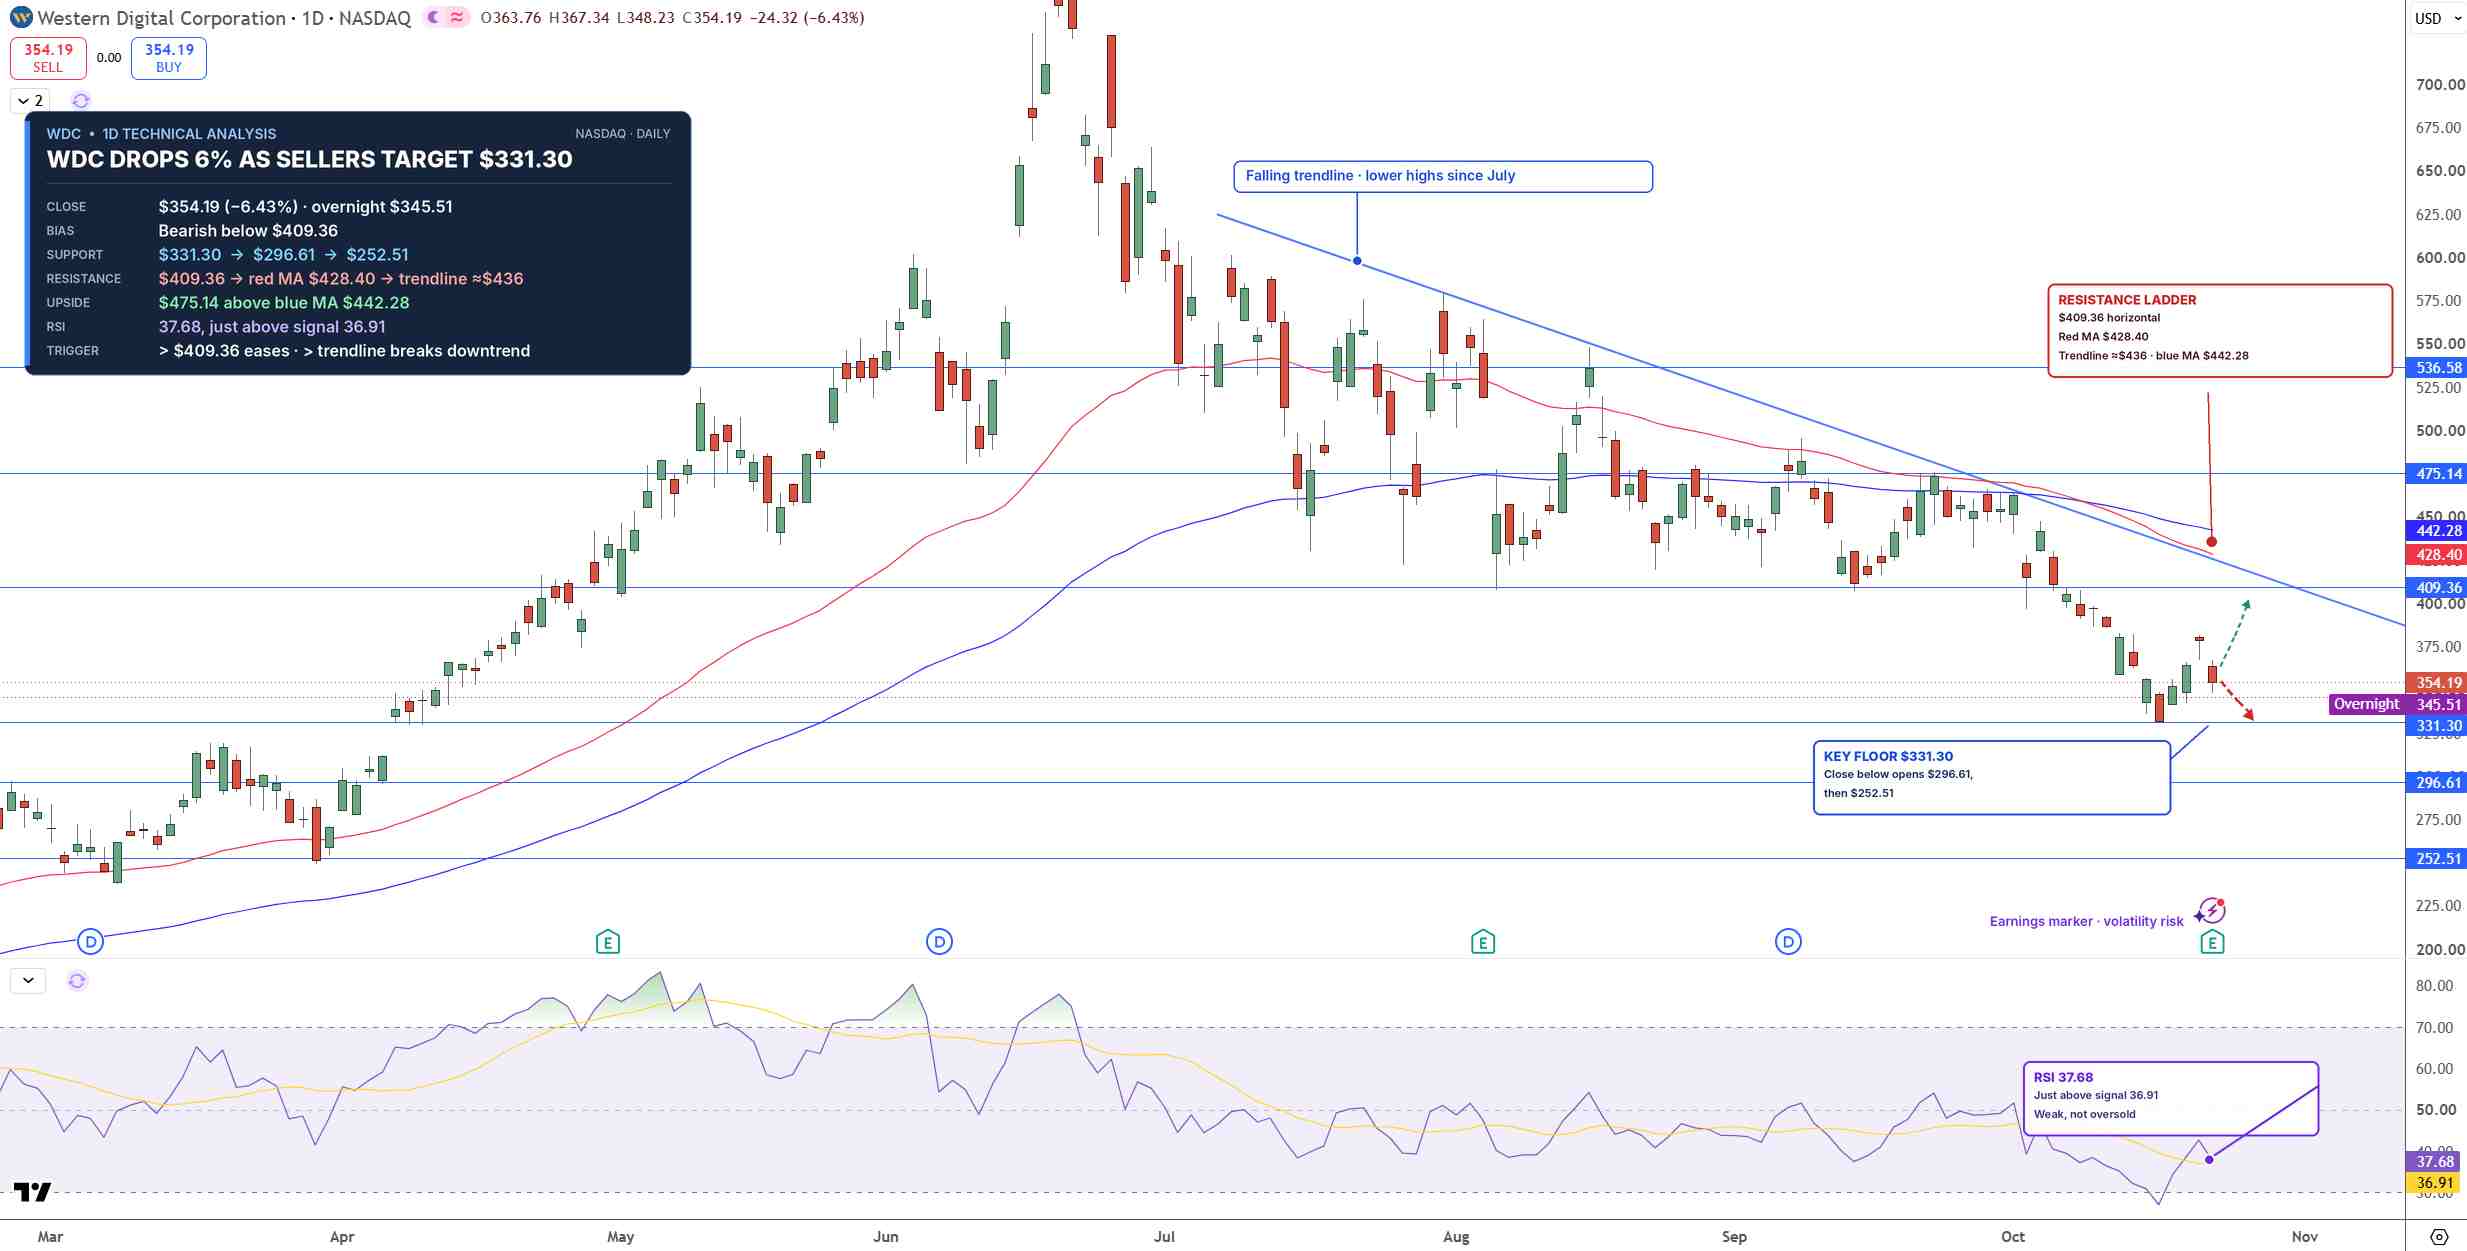
WDC Price Chart - Source: Tradingview
A daily close below $331.30 would open the way for $296.61. On the upside, WDC needs a daily close above $409.36 to break the downtrend, which would open $475.14. Even then, both moving averages sit higher, so the stock would still have to work through $428.40 and $442.28 on the way.
I lean bearish while WDC stays below $409.36.
Key Levels
- Last close: $354.19, down 6.43% on October 22
- Support: $331.30, $296.61
- Resistance: $409.36, $428.40, $442.28, $475.14
- RSI: 37.68, below the 50 midline
- Bullish trigger: Daily close above $409.36
- Bearish trigger: Daily close below $331.30
FAQs
Why did Western Digital stock fall after earnings?
Western Digital beat Q1 estimates and guided Q2 EPS about 20% above consensus, but shares fell 6.49% after hours as the AI selloff continued and the CFO said capex will run modestly above its 4% to 6% target for two years.
What is the Western Digital stock forecast after earnings?
The bias is bearish below $409.36. A daily close below $331.30 targets $296.61, while a close above $409.36 would break the downtrend and open $475.14.
Bottom Line
Western Digital is guiding gross margins above 60% and EPS well ahead of consensus, but the chart still shows a downtrend, with every rally since July stopping at a lower high. The level that matters is $331.30, which the after-hours drop already tested. In my view, a daily close below it opens $296.61, and only a close above $409.36 would change that.
Nothing in this material constitutes investment advice, personal recommendation, investment research, an offer, or a solicitation to buy or sell any financial instrument. The content has been prepared without consideration of your individual investment objectives, financial situation, or needs, and should not be treated as such.
Past performance is not a reliable indicator of future performance and/or results. Forward-looking scenarios or forecasts are not a guarantee of future performance. Actual results may differ materially from those anticipated.
Mitrade makes no representation or warranty as to the accuracy or completeness of the information provided and accepts no liability for any loss arising from reliance on such information.
Recommended Articles


