


CFDs are complex instruments and come with a high risk of losing money rapidly due to leverage. 83% of retail investor accounts lose money when trading CFDs with this provider. You should consider whether you understand how CFDs work and whether you can afford to take the high risk of losing your money.

Nvidia Stock Price Forecast: Shares Hit Nearly Three-Month Low Amid Seven-Day Losing Streak, Risking Drop Toward $165

Source Tradingkey

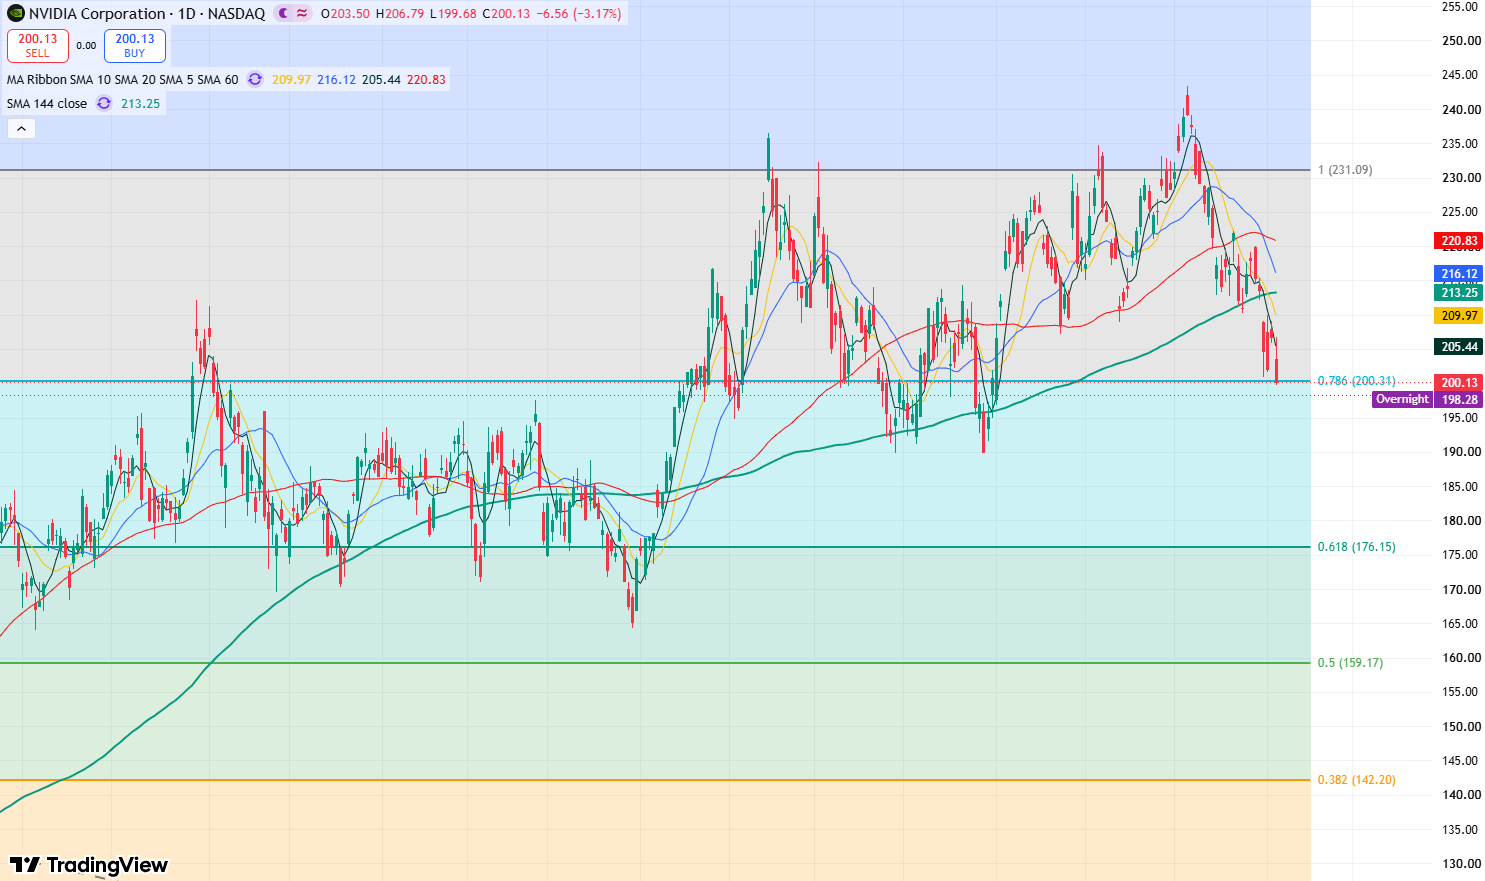
TradingKey - At the close on November 4 Eastern Time, Nvidia (NVDA) shares weakened again, closing down 3.17% at $200.13 after falling to an intraday low of $199.68, marking a seventh consecutive losing session and hitting a near three-month low. Since reaching an all-time high of $243.37 on October 6, Nvidia has retreated more than 16% cumulatively, recently breaking below multiple key moving averages as its short-term downtrend persists.

Nvidia's recent ongoing pullback is linked to a broader cooling across the AI tech sector. Since October, major tech companies including Alphabet (GOOGL), Meta (META), and Amazon (AMZN) have continued to increase AI infrastructure capital expenditures, shifting market focus from the scale of AI investments to whether these outlays can generate sufficient returns.

Meanwhile, uncertainty surrounding the Chinese market has also added pressure on the stock. According to IDC data, Nvidia's share of China's data center AI chip market fell to 34% in the first half of 2026, with AI accelerator shipments down 44% year over year. U.S. export restrictions and market share gains by domestic vendors such as Huawei were cited as key factors.
nvda-fc933daaa916468a8e786d70feb9c621

Nvidia stock daily chart, Source: TradingView

On Nvidia's daily chart, the stock recently broke below the $210 support level and fell through its 144-day moving average, significantly boosting bearish momentum. Meanwhile, the 5-day, 10-day, and 20-day moving averages crossed below the 60-day and 144-day moving averages in succession, forming death crosses across the moving average system that further reinforced bearish momentum, signaling that the stock may continue to slide in the short term.

On the technical front, the Relative Strength Index (RSI) sits near 34.6, leaving some room before entering oversold territory, while the MACD remains in negative territory, showing that downside momentum has not yet fully dissipated.

For now, the stock may continue to decline in the short term, with key immediate support at $190. If the stock falls below this level, it will open downside room toward the low of around $165 reached on March 30 this year.

Conversely, if the stock stabilizes above $190, a short-term rebound will emerge, with the primary target testing the $207–$210 range. If it can hold firmly above $210, the stock will test resistance at $220, and further upside could challenge the all-time high of $243.37.

Disclaimer: The content available on Mitrade Insights is provided for informational and marketing purposes only. It has not been prepared in accordance with legal requirements designed to promote the independence of investment research and is not subject to any prohibition on dealing ahead of the dissemination of investment research
Nothing in this material constitutes investment advice, personal recommendation, investment research, an offer, or a solicitation to buy or sell any financial instrument. The content has been prepared without consideration of your individual investment objectives, financial situation, or needs, and should not be treated as such.
Past performance is not a reliable indicator of future performance and/or results. Forward-looking scenarios or forecasts are not a guarantee of future performance. Actual results may differ materially from those anticipated.
Mitrade makes no representation or warranty as to the accuracy or completeness of the information provided and accepts no liability for any loss arising from reliance on such information.
placeholder
GBP/USD Price Forecast: Softens below 1.3500 but retains positive technical outlookThe GBP/USD pair loses momentum near 1.3485 during the early European session on Monday, pressured by renewed US Dollar (USD) demand. The potential downside for a major pair might be limited, as the Bank of England (BoE) guided that monetary policy will remain on a gradual downward path.
Author  FXStreet
Dec 29, 2025
The GBP/USD pair loses momentum near 1.3485 during the early European session on Monday, pressured by renewed US Dollar (USD) demand. The potential downside for a major pair might be limited, as the Bank of England (BoE) guided that monetary policy will remain on a gradual downward path.
placeholder
Crypto Majors Stall as Bitcoin, Ether, and XRP Struggle to Shake Off Bearish OverhangBitcoin steadies at $70k while Ethereum and XRP face key resistance levels; technicals show bearish MACD crossovers despite oversold RSI conditions.
Author  Mitrade
Aug 18, Tue
Bitcoin steadies at $70k while Ethereum and XRP face key resistance levels; technicals show bearish MACD crossovers despite oversold RSI conditions.
placeholder
Japan's Nikkei closes at record high as tech earnings overshadow Mideast concernsBy Rocky Swift TOKYO, April 24 (Reuters) - Japan's Nikkei set a closing record high on Friday, capping a third consecutive weekly gain, as enthusiasm over technology sector earnings offset uncertainty over a potential peace deal in the Middle East.The benchmark Nikkei 225 Index .N225 rose 0.9...
Author  Reuters
Apr 24, Fri
By Rocky Swift TOKYO, April 24 (Reuters) - Japan's Nikkei set a closing record high on Friday, capping a third consecutive weekly gain, as enthusiasm over technology sector earnings offset uncertainty over a potential peace deal in the Middle East.The benchmark Nikkei 225 Index .N225 rose 0.9...
placeholder
BTC holds recent gains above 50-day EMA amid improving momentumBitcoin (BTC) slides slightly but holds most of the recent gains, reclaiming the 50-day Exponential Moving Average (EMA) at $64,300 at the time of writing on Tuesday after rising 2.5% the previous day.
Author  FXStreet
Aug 18, Tue
Bitcoin (BTC) slides slightly but holds most of the recent gains, reclaiming the 50-day Exponential Moving Average (EMA) at $64,300 at the time of writing on Tuesday after rising 2.5% the previous day.
placeholder
WTI Price Forecast: Climbs above $86.00 as 100-day SMA breakout comes into playWest Texas Intermediate (WTI) – the benchmark US Crude Oil price – attracts buyers for the second straight day on Tuesday as escalating US-Iran tensions and the standoff over the Strait of Hormuz continue to fuel supply concerns.
Author  FXStreet
Sep 01, Tue
West Texas Intermediate (WTI) – the benchmark US Crude Oil price – attracts buyers for the second straight day on Tuesday as escalating US-Iran tensions and the standoff over the Strait of Hormuz continue to fuel supply concerns.
goTop
quote