



Netflix Inc Stock (NFLX) Moved Down by 3.70% on Sep 4: What Investors Need To Know
Netflix Inc (NFLX) moved down by 3.70%. The Software & IT Services sector is down by 1.30%. The company underperformed the industry. Top 3 stocks by turnover in the sector: Meta Platforms Inc (META) up 0.13%; Oracle Corp (ORCL) up 2.52%; Microsoft Corp (MSFT) down 1.87%.
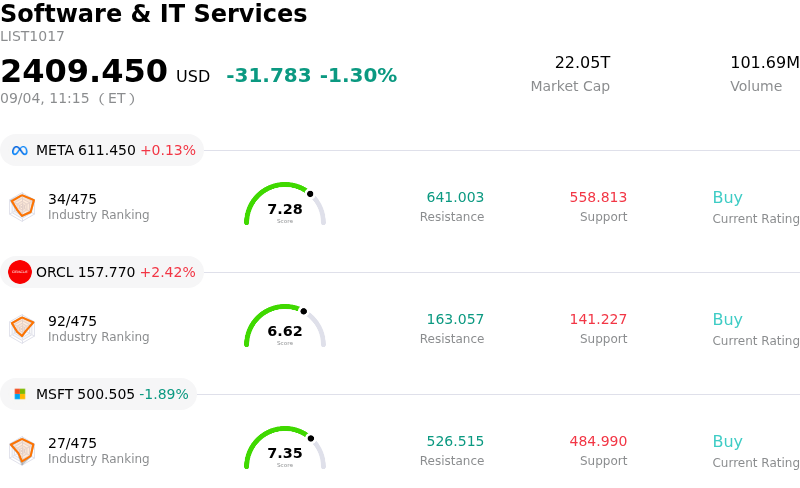
What is driving Netflix Inc (NFLX)’s stock price down today?
Netflix experienced heightened intraday volatility and closed lower, reversing part of its recent multi-session recovery. The pullback reflects a mix of short-term profit-taking following a rebound from recent lows and ongoing investor caution regarding the company's near-term growth trajectory. Despite broader technology sector resilience, streaming market headwinds and ongoing valuation recalibrations continue to weigh on market sentiment.
The primary fundamental overhang stems from the company's recent quarterly performance and cautious forward guidance. While top-line revenue and user engagement remain solid, forward revenue guidance for the third quarter fell slightly short of Wall Street consensus estimates, intensifying market debate over top-line deceleration in mature geographic markets. Additionally, modest operating margin compression driven by elevated content spending and cash tax obligations has prompted a discipline-driven contraction in the stock's forward price-to-earnings valuation multiple compared to historical averages.
On the operational front, Netflix continues to scale its ad-supported subscription tier, leveraging expanded programmatic ad tools and live-event streaming inventory to capture market share. However, newly announced subscription price increases across key European markets have drawn a mixed response from investors. Local regulatory requirements that necessitate explicit subscriber consent may delay the full financial benefits of these price adjustments into upcoming fiscal periods, tempering immediate margin enthusiasm. While institutional analysts highlight that substantial share buyback programs and expanding ad revenues offer long-term valuation support, short-term price action remains constrained by market sensitivity toward growth visibility.
Technical Analysis of Netflix Inc (NFLX)
Technically, Netflix Inc (NFLX) shows a MACD (12,26,9) value of 0.016, indicating a buy signal. The RSI at 52.689 suggests neutral condition and the Williams %R at 55.785 suggests sell condition. Please monitor closely.
Media Coverage of Netflix Inc (NFLX)
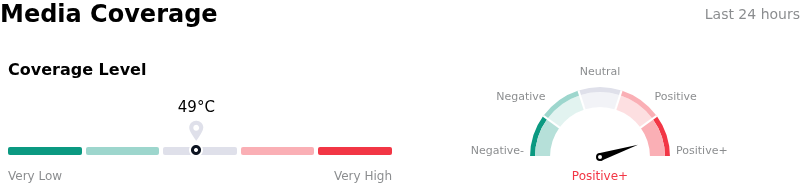
In terms of media coverage, Netflix Inc (NFLX) shows a coverage score of 49, indicating a moderate level of media attention. The overall market sentiment index is currently in extremely bullish zone.
Fundamental Analysis of Netflix Inc (NFLX)
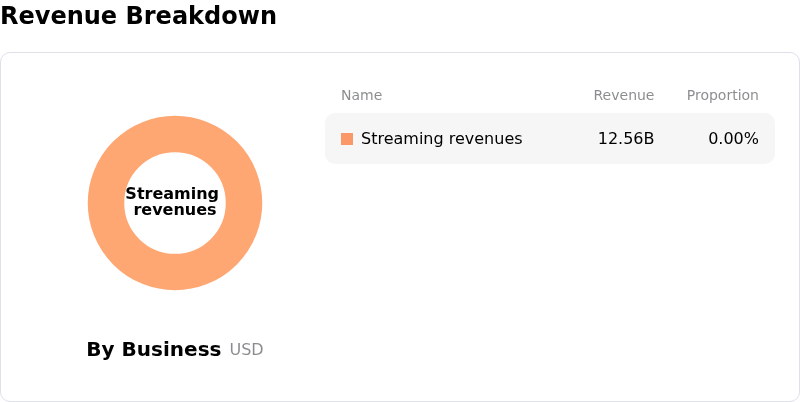
Netflix Inc (NFLX) is in the Software & IT Services industry. Its latest annual revenue is $45.18B, ranking 12 in the industry. The net profit is $10.98B, ranking 10 in the industry. Company Profile
Over the past month, multiple analysts have rated the company as Buy, with an average price target of $96.53, a high of $150.00, and a low of $70.00.
More details about Netflix Inc (NFLX)
Company Specific Risks:
- Guidance Downgrade and Revenue Growth Deceleration: Projected Q3 revenue growth of 11.7% to $12.86 billion missed Wall Street consensus expectations of $13.01 billion, marking the platform's slowest quarterly revenue expansion in three years and forcing analysts to trim full-year midpoint revenue targets.
- Margin Compression and Cash Flow Drag: Operating margins contracted year-over-year to 33.4%, while free cash flow experienced significant downward pressure due to elevated tax liabilities and termination fees incurred from the abandoned bid for Warner Bros. Discovery.
- Reduced Operational Transparency: Wall Street analysts and institutional investors expressed concern over management's policy shift to report viewing-hours engagement data less frequently, raising fears of deteriorating user engagement visibility.
- Executive Insider Selling via SEC Filings: Recent SEC Form 4 disclosures reveal multi-million-dollar stock sales by senior leadership—including Co-CEOs Greg Peters and Ted Sarandos—amplifying market skepticism and institutional distribution pressure.
Nothing in this material constitutes investment advice, personal recommendation, investment research, an offer, or a solicitation to buy or sell any financial instrument. The content has been prepared without consideration of your individual investment objectives, financial situation, or needs, and should not be treated as such.
Past performance is not a reliable indicator of future performance and/or results. Forward-looking scenarios or forecasts are not a guarantee of future performance. Actual results may differ materially from those anticipated.
Mitrade makes no representation or warranty as to the accuracy or completeness of the information provided and accepts no liability for any loss arising from reliance on such information.
Recommended Articles


