



EUR/USD Price Forecast: Euro forms potential higher low above 100-day SMA
- EUR/USD recovers most of its NFP-driven decline as the US Dollar loses momentum.
- The 200-day Simple Moving Average at 1.1634 caps the immediate upside.
- Momentum indicators lean mildly bullish, with the RSI holding above the neutral 50 level.
EUR/USD sees sharp two-way price swings on Friday after a stronger-than-expected United States (US) employment report triggers fresh volatility. The pair initially fell to an intraday low of 1.1585 before recovering as the US Dollar (USD) struggled to sustain its gains. At the time of writing, EUR/USD trades around 1.1620.
The US Dollar Index (DXY), which tracks the Greenback’s value against a basket of six major currencies, trades around 99.10 after climbing as high as 99.36 following the employment report.
Technical analysis
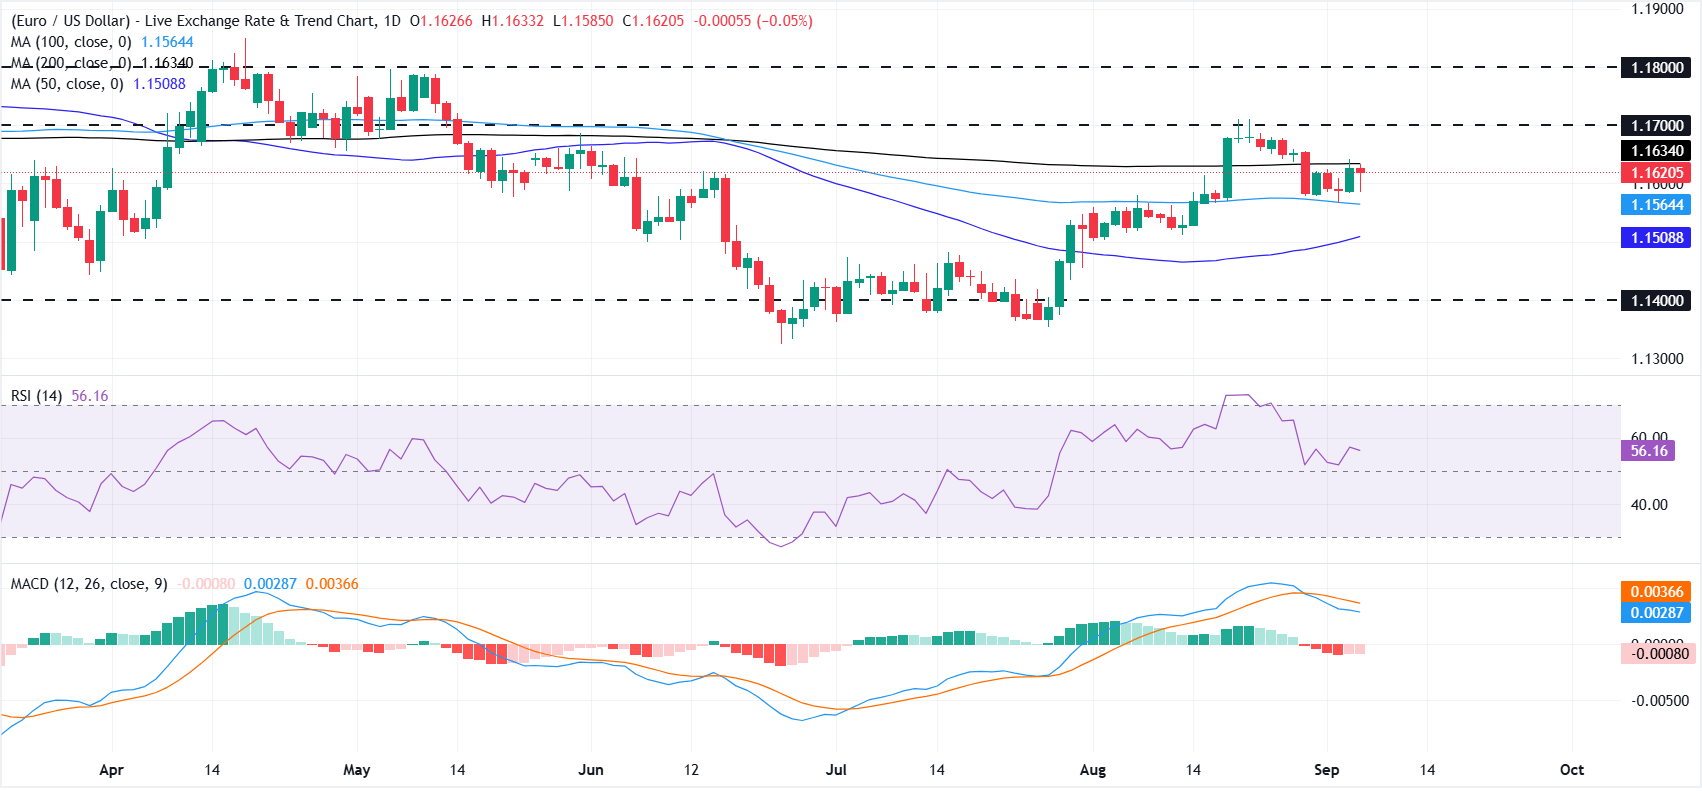
On the daily chart, EUR/USD remains trapped between the 100-day Simple Moving Average (SMA) at 1.1564 and the 200-day SMA at 1.1634, leaving the pair in a narrow consolidation range.
The broader price structure retains a modest bullish bias. EUR/USD has formed a sequence of higher highs and higher lows since recovering from below 1.1400 in late July and reaching 1.1711 on August 21. The latest price action suggests that another higher low may be developing above the 100-day SMA, although buyers still need to clear the 200-day average to regain control.
The Relative Strength Index (RSI) has eased from the overbought levels reached around the August 21 high but holds above the neutral 50 mark at approximately 56, indicating that bullish momentum has weakened without disappearing entirely.
Meanwhile, the Moving Average Convergence Divergence (MACD) remains marginally below zero, pointing to a mild bearish bias. However, the fading red histogram bars suggest that downside momentum is losing strength.
On the upside, a break above the 200-day SMA near 1.1634 could pave the way toward the 1.1700 mark, followed by the more distant resistance zone around 1.1800.
On the downside, immediate support emerges at the 100-day SMA around 1.1564, followed by the 50-day SMA near 1.1508. A deeper decline would expose the horizontal support region around 1.1400.
(The technical analysis of this story was written with the help of an AI tool. Know more.)
Euro FAQs
The Euro is the currency for the 20 European Union countries that belong to the Eurozone. It is the second most heavily traded currency in the world behind the US Dollar. In 2022, it accounted for 31% of all foreign exchange transactions, with an average daily turnover of over $2.2 trillion a day. EUR/USD is the most heavily traded currency pair in the world, accounting for an estimated 30% off all transactions, followed by EUR/JPY (4%), EUR/GBP (3%) and EUR/AUD (2%).
The European Central Bank (ECB) in Frankfurt, Germany, is the reserve bank for the Eurozone. The ECB sets interest rates and manages monetary policy. The ECB’s primary mandate is to maintain price stability, which means either controlling inflation or stimulating growth. Its primary tool is the raising or lowering of interest rates. Relatively high interest rates – or the expectation of higher rates – will usually benefit the Euro and vice versa. The ECB Governing Council makes monetary policy decisions at meetings held eight times a year. Decisions are made by heads of the Eurozone national banks and six permanent members, including the President of the ECB, Christine Lagarde.
Eurozone inflation data, measured by the Harmonized Index of Consumer Prices (HICP), is an important econometric for the Euro. If inflation rises more than expected, especially if above the ECB’s 2% target, it obliges the ECB to raise interest rates to bring it back under control. Relatively high interest rates compared to its counterparts will usually benefit the Euro, as it makes the region more attractive as a place for global investors to park their money.
Data releases gauge the health of the economy and can impact on the Euro. Indicators such as GDP, Manufacturing and Services PMIs, employment, and consumer sentiment surveys can all influence the direction of the single currency. A strong economy is good for the Euro. Not only does it attract more foreign investment but it may encourage the ECB to put up interest rates, which will directly strengthen the Euro. Otherwise, if economic data is weak, the Euro is likely to fall. Economic data for the four largest economies in the euro area (Germany, France, Italy and Spain) are especially significant, as they account for 75% of the Eurozone’s economy.
Another significant data release for the Euro is the Trade Balance. This indicator measures the difference between what a country earns from its exports and what it spends on imports over a given period. If a country produces highly sought after exports then its currency will gain in value purely from the extra demand created from foreign buyers seeking to purchase these goods. Therefore, a positive net Trade Balance strengthens a currency and vice versa for a negative balance.
Nothing in this material constitutes investment advice, personal recommendation, investment research, an offer, or a solicitation to buy or sell any financial instrument. The content has been prepared without consideration of your individual investment objectives, financial situation, or needs, and should not be treated as such.
Past performance is not a reliable indicator of future performance and/or results. Forward-looking scenarios or forecasts are not a guarantee of future performance. Actual results may differ materially from those anticipated.
Mitrade makes no representation or warranty as to the accuracy or completeness of the information provided and accepts no liability for any loss arising from reliance on such information.
Recommended Articles


