



United States Dollar Index rises as strong NFP revives Fed hike bets
- DXY rebounds as August NFP crushes expectations with 162K jobs.
- Strong labor market lifts September Fed hike odds to 63%.
- Next week’s CPI and PPI could confirm tightening risks.
The United States Dollar Index (DXY) rises some 0.17% following a stellar Nonfarm Payrolls report, with the economy creating nearly three times as many jobs as expected by most economists, as revealed by the Bureau of Labour Statistics (BLS). The DXY trades at 99.17, after bouncing off a daily low of 98.91.
DXY gains after strong jobs data lift September hike expectations
Data from the US revealed that the economy added more people to the workforce than expected. Over 162K Americans entered the workforce in August, well above estimates of 56K and crushing July’s upwardly revised report from -23K to 21K. The same report revealed that the Unemployment Rate stood at 4.1%, beneath Fed officials' estimates of 4.5% towards the end of the year.
Immediately after the data, DXY jumped towards the high of the day (HOD) at 99.39, before trimming some of its gains. US Treasury yields followed suit, but the move faded.
The strength of the labour market increased the chances of a Fed rate hike at the September 16 meeting. The swaps market shows a 63% probability of a 25-bps increase in the Fed funds rate, up from 54% a day ago, according to Prime Terminal.
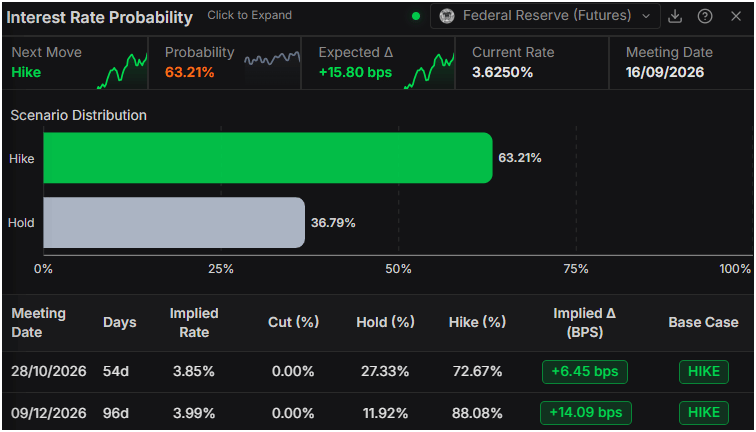
Now with US jobs data on the rearview mirror, traders are set for next week’s inflation reports, first on the producer and then on the consumer side. If both show that the disinflation process is not evolving, this could warrant a rate hike.
On Thursday, Fed Governor Christopher Waller stated that the Fed is in no rush to raise rates if inflation cools down. However, a bad print next week could keep the next Federal Open Market Committee meeting open.
US Dollar Index Price Forecast: Technical outlook
In the daily chart, Dollar Index Spot trades at 99.09. The near-term tone is bearish as price holds below the clustered 50-, 100- and 200-day simple moving averages around 100.22 and also beneath the previously supportive primary uptrend line now referenced near 100.15, while a descending trend line from 101.80 keeps the broader recovery attempt capped around 101.26. The Relative Strength Index (14) at about 42 sits below the midline, hinting at lingering downside pressure rather than an imminent bullish reversal.
On the topside, initial resistance is seen at the broken trend-line region around 100.15, followed closely by the dense simple moving average cluster near 100.22, with the downtrend reference level at 101.26 acting as a more distant cap if a bounce extends. On the downside, the first notable support is the secondary rising trend line projecting near 98.72, where failure would expose lower levels in the broader range and reinforce the prevailing bearish bias.
(The technical analysis of this story was written with the help of an AI tool. Know more.)
Nothing in this material constitutes investment advice, personal recommendation, investment research, an offer, or a solicitation to buy or sell any financial instrument. The content has been prepared without consideration of your individual investment objectives, financial situation, or needs, and should not be treated as such.
Past performance is not a reliable indicator of future performance and/or results. Forward-looking scenarios or forecasts are not a guarantee of future performance. Actual results may differ materially from those anticipated.
Mitrade makes no representation or warranty as to the accuracy or completeness of the information provided and accepts no liability for any loss arising from reliance on such information.
Recommended Articles


