



Synopsys Inc Stock (SNPS) Moved Down by 5.56% on Sep 4: Key Drivers Unveiled
Synopsys Inc (SNPS) moved down by 5.56%. The Software & IT Services sector is down by 1.12%. The company underperformed the industry. Top 3 stocks by turnover in the sector: Meta Platforms Inc (META) down 0.11%; Oracle Corp (ORCL) up 2.44%; Microsoft Corp (MSFT) down 1.79%.
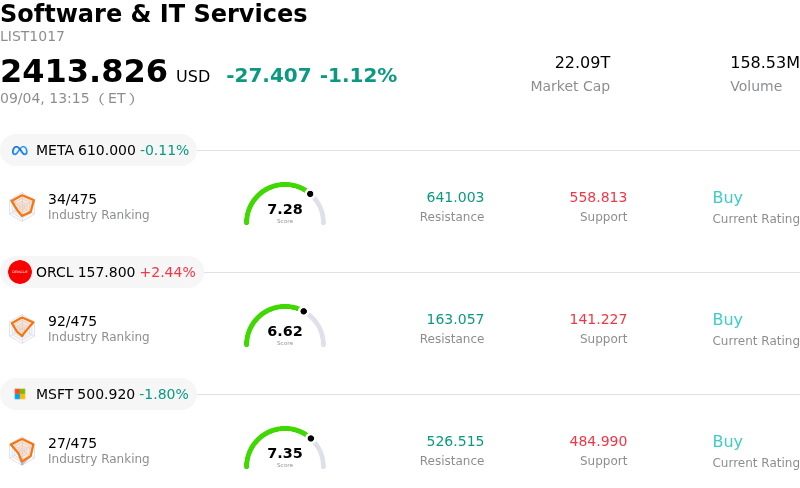
What is driving Synopsys Inc (SNPS)’s stock price down today?
Synopsys experienced downward momentum and notable intraday volatility as negative sentiment outweighed otherwise strong fundamental performance. The pressure comes despite the company recently posting robust fiscal third-quarter results that surpassed Wall Street consensus on both revenue and earnings per share, alongside a full-year guidance raise. While demand for electronic design automation tools and semiconductor intellectual property remains elevated due to the global artificial intelligence infrastructure expansion, investors have taken a cautious stance, choosing to lock in profits following the quarterly report.
The primary drivers behind the downward price action center on valuation constraints, balance sheet leverage, and integration noise. Trading at an elevated valuation multiple relative to historical software benchmarks, Synopsys faced valuation compression as broader market sentiment turned sensitive to macroeconomic factors and rising bond yields. Furthermore, the digestion of its large-scale Ansys acquisition continues to weigh on investor sentiment. Although operational synergies are proceeding ahead of schedule, the transaction expanded the company's debt burden to near ten billion dollars while adding substantial quarterly non-cash intangible amortization expenses and planned restructuring costs that muddy reported profit margins.
Additional headwinds include geopolitical risks and regulatory overhangs related to U.S. export controls on advanced semiconductor software and hardware in China, which create lingering revenue uncertainty for high-margin design IP licenses. Recent insider share sales under pre-arranged trading plans have further dampened retail and institutional sentiment in the short term. Looking forward, while Synopsys retains a dominant market position in the electronic design automation duopoly and benefits from secular AI chip complexity, the market is demanding clearer evidence of debt reduction, organic growth acceleration, and margin expansion before re-rating the stock upward.
Technical Analysis of Synopsys Inc (SNPS)
Technically, Synopsys Inc (SNPS) shows a MACD (12,26,9) value of -1.554, indicating a neutral signal. The RSI at 42.287 suggests neutral condition and the Williams %R at 85.276 suggests oversold condition. Please monitor closely.
Media Coverage of Synopsys Inc (SNPS)
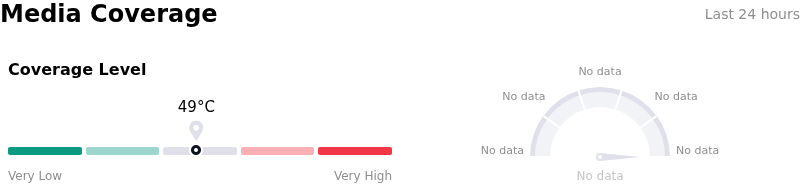
In terms of media coverage, Synopsys Inc (SNPS) shows a coverage score of 49, indicating a moderate level of media attention. The overall market sentiment index is currently in extremely bullish zone.
Fundamental Analysis of Synopsys Inc (SNPS)
Synopsys Inc (SNPS) is in the Software & IT Services industry. Its latest annual revenue is $7.05B, ranking 46 in the industry. The net profit is $1.33B, ranking 39 in the industry. Company Profile
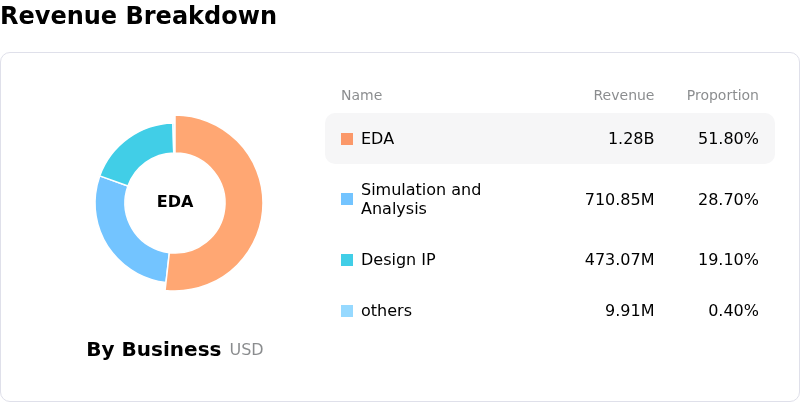
Over the past month, multiple analysts have rated the company as Buy, with an average price target of $545.02, a high of $633.00, and a low of $414.77.
More details about Synopsys Inc (SNPS)
Company Specific Risks:
- Executive Insider Dispositions: SEC filings disclosuring Executive Chair Aart de Geus's sale of 25,000 shares worth approximately $11.1 million—reducing his direct stake by over 17%—have triggered immediate downward pressure and negatively impacted market sentiment.
- Post-Acquisition Debt and Integration Overhead: The ongoing integration of Ansys leaves Synopsys burdened with roughly $10 billion in total debt alongside escalating synergy-related restructuring expenses, creating financial leverage risks and reducing operational flexibility.
- Valuation De-rating and Analyst Downgrades: Recent analyst rating downgrades highlight that the stock's valuation has outstripped immediate fundamental growth, leaving its elevated price-to-earnings multiple vulnerable to severe multiple compression on any execution misstep.
- Macro Sensitivity and Semiconductor Expenditure Exposure: Surging bond yields have placed high-multiple growth software equities under pressure, exposing Synopsys to heightened volatility should enterprise customers dial back Electronic Design Automation (EDA) and semiconductor IP design budgets.
Nothing in this material constitutes investment advice, personal recommendation, investment research, an offer, or a solicitation to buy or sell any financial instrument. The content has been prepared without consideration of your individual investment objectives, financial situation, or needs, and should not be treated as such.
Past performance is not a reliable indicator of future performance and/or results. Forward-looking scenarios or forecasts are not a guarantee of future performance. Actual results may differ materially from those anticipated.
Mitrade makes no representation or warranty as to the accuracy or completeness of the information provided and accepts no liability for any loss arising from reliance on such information.
Recommended Articles


