



Hewlett Packard Enterprise Co Stock (HPE) Moved Down by 5.33% on Sep 4: Drivers Behind the Movement
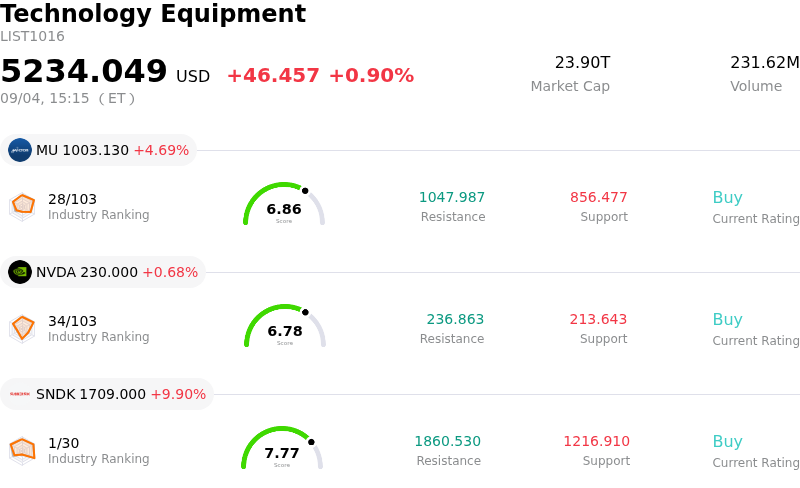
Hewlett Packard Enterprise Co (HPE) moved down by 5.33%. The Technology Equipment sector is up by 0.90%. The company underperformed the industry. Top 3 stocks by turnover in the sector: Micron Technology Inc (MU) up 4.65%; NVIDIA Corp (NVDA) up 0.68%; SanDisk Corporation (SNDK) up 9.90%.
What is driving Hewlett Packard Enterprise Co (HPE)’s stock price down today?
Hewlett Packard Enterprise experienced notable downward pressure as investor enthusiasm over stronger-than-expected third-quarter fiscal 2026 financial results was overshadowed by concerns regarding profitability and supply chain friction. Despite delivering top-line and bottom-line beats alongside an upgraded full-year outlook, market sentiment was negatively impacted by management's cautious commentary on future profit margins. Specifically, executives signaled that gross margins are poised to moderate toward historical levels as lower-margin artificial intelligence server deployments account for a larger proportion of total revenue, compounded by the normalization of traditional server pricing.
Adding to investor apprehension is the ongoing challenge of converting record order growth into near-term shipments. Although enterprise demand for artificial intelligence infrastructure and networking equipment pushed the company's order backlog to unprecedented levels, persistent supply constraints in memory chips and component availability continue to delay fulfillment. Market participants remain concerned that these supply chain bottlenecks could slow the pace at which bookings translate into realized cash flow, elevating operational execution risk for upcoming quarters.
The broader decline was further reinforced by selective analyst target price adjustments and institutional profit-taking following a strong multi-month run-up in the stock. Several research firms tempered their valuation targets to reflect potential gross margin compression and rising input costs, prompting investors to re-evaluate near-term growth trajectories. Given the equity's substantial gains leading into the report, market participants capitalized on the event to rebalance portfolios, driving heightened trading volume and downside volatility.
Technical Analysis of Hewlett Packard Enterprise Co (HPE)
Technically, Hewlett Packard Enterprise Co (HPE) shows a MACD (12,26,9) value of -1.098, indicating a neutral signal. The RSI at 48.038 suggests neutral condition and the Williams %R at 51.735 suggests neutral condition. Please monitor closely.
Media Coverage of Hewlett Packard Enterprise Co (HPE)
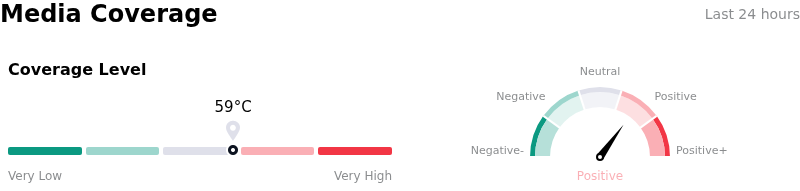
In terms of media coverage, Hewlett Packard Enterprise Co (HPE) shows a coverage score of 59, indicating a moderate level of media attention. The overall market sentiment index is currently in bullish zone.
Fundamental Analysis of Hewlett Packard Enterprise Co (HPE)
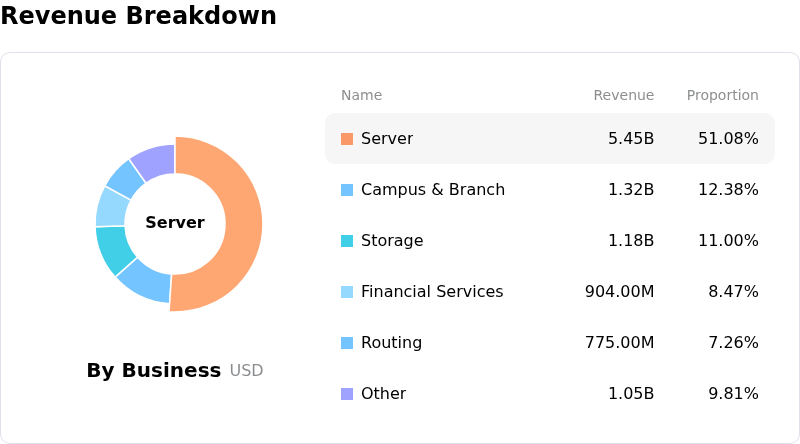
Hewlett Packard Enterprise Co (HPE) is in the Technology Equipment industry. Its latest annual revenue is $34.30B, ranking 7 in the industry. The net profit is $-59.00M, ranking 38 in the industry. Company Profile
Over the past month, multiple analysts have rated the company as Buy, with an average price target of $67.58, a high of $88.00, and a low of $52.00.
More details about Hewlett Packard Enterprise Co (HPE)
Company Specific Risks:
- Severe Component Supply Bottlenecks: Despite a 42% year-over-year surge in orders, acute shortages in critical components—including high-bandwidth memory (HBM), DDR5, NAND, and silicon wafers—are preventing HPE from converting its record backlog into recognized revenue, causing significant shipment delays across Cloud and AI server lines.
- AI Systems Product Mix Margin Dilution: Wall Street analysts highlighted gross margin compression as HPE's revenue shifts heavily toward AI systems. Because AI infrastructure carries structurally lower profit margins than traditional enterprise servers, management noted that profit margins will normalize lower as AI deployment scales.
- Anticipated FY27 Revenue Growth Deceleration: Although HPE raised its fiscal 2026 revenue guidance, management outlined an initial fiscal 2027 growth framework of 13% to 17%, representing a sharp deceleration from the 34% to 37% rate in fiscal 2026 and sparking institutional concerns over demand post-peak buildout.
- Inventory and Capital Commitments Exposure: To secure scarce hardware, HPE is entering aggressive multi-year procurement commitments and building inventory ahead of sales. This exposes the balance sheet to inventory risk or margin compression if component pricing ("chipflation") remains elevated or if customer pricing power softens.
Nothing in this material constitutes investment advice, personal recommendation, investment research, an offer, or a solicitation to buy or sell any financial instrument. The content has been prepared without consideration of your individual investment objectives, financial situation, or needs, and should not be treated as such.
Past performance is not a reliable indicator of future performance and/or results. Forward-looking scenarios or forecasts are not a guarantee of future performance. Actual results may differ materially from those anticipated.
Mitrade makes no representation or warranty as to the accuracy or completeness of the information provided and accepts no liability for any loss arising from reliance on such information.
Recommended Articles


