



Bloom Energy Corp Stock (BE) Closed Up by 7.35% on Sep 4: Facts Behind the Movement
Bloom Energy Corp (BE) closed up by 7.35%. The Industrial Goods sector is up by 0.77%. The company outperformed the industry. Top 3 stocks by turnover in the sector: Bloom Energy Corp (BE) up 7.35%; Caterpillar Inc (CAT) up 1.72%; Boeing Co (BA) up 0.83%.
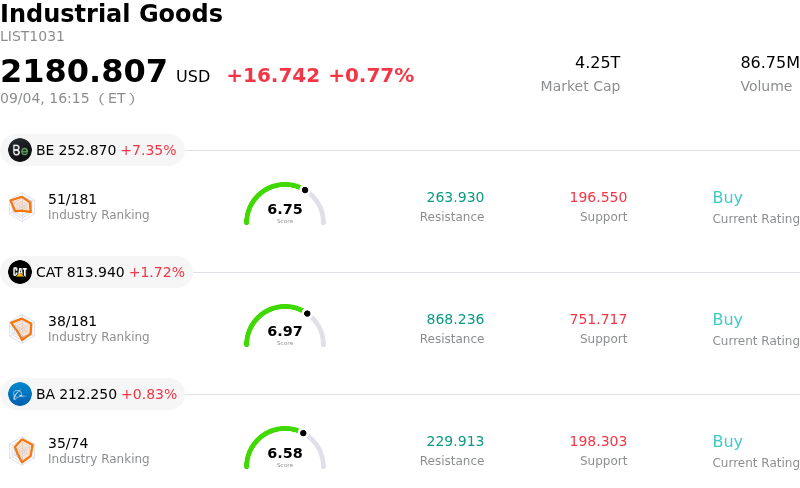
What is driving Bloom Energy Corp (BE)’s stock price up today?
Bloom Energy experienced strong upward price momentum, propelled by a convergence of macroeconomic tailwinds and expanding demand from energy-intensive artificial intelligence infrastructure. Recent dovish policy signals from Federal Reserve officials and declining benchmark Treasury yields have provided a favorable environment for capital-intensive clean technology equities. Lower borrowing costs reduce financing expenses for large-scale power installations, improving forward valuation models. More fundamentally, physical grid constraints and multi-year interconnection queues across major power hubs continue to force hyperscalers and data center developers toward on-site power solutions. Bloom Energy's solid oxide fuel cell technology directly addresses this bottleneck, allowing AI data center operators to secure reliable prime power without waiting for traditional utility grid expansion.
Market sentiment was further energized by institutional positioning and speculative option flows surrounding upcoming index rebalancing. Anticipation of potential major benchmark index inclusion drove heavy call option volume and heightened intraday volatility, drawing momentum-focused traders into the name. This technical catalyst sits atop strong fundamental execution, following the company's recent quarterly performance where it reported record revenue growth, expanded operating margins, and raised full-year operational guidance. With hyperscalers and utility partners committing multibillion-dollar framework agreements to deploy fuel cell facilities, institutional investors increasingly view Bloom as a primary beneficiary of the private power generation shift.
Despite the bullish momentum, investors should remain mindful of near-term risk factors and elevated valuation levels. The stock trades at a notable premium relative to industrial and clean technology peers, leaving limited margin for operational delays in converting framework agreements into firm, signed contracts. Furthermore, ongoing supply chain scrutiny regarding raw material sourcing and pending securities class action litigation present potential headline risks. Nevertheless, the combination of structural power shortages in the technology sector, robust quarterly execution, and speculative index tailwinds continues to drive strong institutional buy-side interest.
Technical Analysis of Bloom Energy Corp (BE)
Technically, Bloom Energy Corp (BE) shows a MACD (12,26,9) value of 8.809, indicating a neutral signal. The RSI at 63.087 suggests neutral condition and the Williams %R at 0.609 suggests overbought condition. Please monitor closely.
Fundamental Analysis of Bloom Energy Corp (BE)
Bloom Energy Corp (BE) is in the Industrial Goods industry. Its latest annual revenue is $2.02B, ranking 78 in the industry. The net profit is $-88.43M, ranking 210 in the industry. Company Profile
Over the past month, multiple analysts have rated the company as Buy, with an average price target of $263.41, a high of $354.00, and a low of $98.94.
More details about Bloom Energy Corp (BE)
Company Specific Risks:
- Pending Securities Class Action and China Supply Chain Disclosures: Active securities litigation and legal alerts regarding an upcoming September 28, 2026 lead plaintiff deadline allege that management misled investors regarding its supply chain independence from China for scandium and rare earth inputs, introducing ongoing legal liabilities, regulatory scrutiny, and supply disruption risks.
- Index Rebalance Speculation and Reversal Vulnerability: Recent intraday price volatility has been driven by speculative institutional positioning ahead of the S&P Dow Jones Indices quarterly rebalance announcement rather than immediate fundamental news, creating severe downside risk if the stock is passed over for S&P 500 inclusion.
- Elevated Valuation Multiples and Backlog Conversion Exposure: Operating at extreme valuation multiples exceeding 280x trailing P/E and 56x NTM EV/EBITDA, the stock leaves no margin for error, leaving shares susceptible to aggressive de-rating if project delivery timelines or data-center order conversions experience operational delays.
- Insider Share Sales and Option Exercise Pressure: Recent SEC Form 4 filings detail CEO option exercises along with a broader trend of insider share sales by executives and directors over recent weeks, creating potential overhead supply pressure and signaling insider profit-taking near valuation highs.
Nothing in this material constitutes investment advice, personal recommendation, investment research, an offer, or a solicitation to buy or sell any financial instrument. The content has been prepared without consideration of your individual investment objectives, financial situation, or needs, and should not be treated as such.
Past performance is not a reliable indicator of future performance and/or results. Forward-looking scenarios or forecasts are not a guarantee of future performance. Actual results may differ materially from those anticipated.
Mitrade makes no representation or warranty as to the accuracy or completeness of the information provided and accepts no liability for any loss arising from reliance on such information.
Recommended Articles


