



Nebius Group NV Stock (NBIS) Moved Up by 5.30% on Sep 4: What Signal Does It Send?
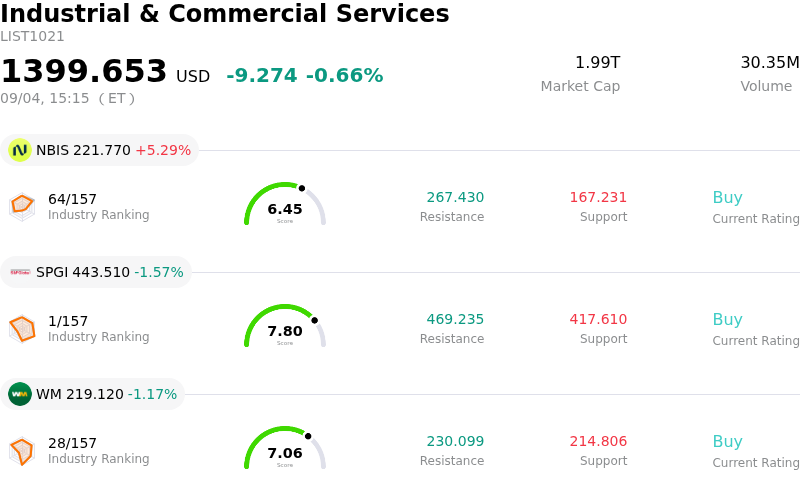
Nebius Group NV (NBIS) moved up by 5.30%. The Industrial & Commercial Services sector is down by 0.66%. The company outperformed the industry. Top 3 stocks by turnover in the sector: Nebius Group NV (NBIS) up 5.29%; S&P Global Inc (SPGI) down 1.57%; Waste Management Inc (WM) down 1.17%.
What is driving Nebius Group NV (NBIS)’s stock price up today?
Nebius Group N.V. experienced upward momentum driven by renewed investor enthusiasm over its expanding artificial intelligence cloud infrastructure footprint and strong multi-year contract pipeline. Recent strategic updates highlighted major AI cloud agreements with prominent foundation model developers and institutional clients, alongside a significant raise in its contracted power target to five gigawatts by year-end. This power capacity expansion reinforces the market's conviction in Nebius's ability to capture surging enterprise GPU compute demand, providing robust revenue visibility moving into 2027.
Market sentiment was further bolstered by management's dynamic pricing strategy and favorable contract structure. By securing high-yield capacity agreements with substantial customer prepayments covering a significant portion of capital expenditures, Nebius has mitigated near-term balance sheet risks associated with its aggressive buildout. Furthermore, the company's ability to command premium pricing on short-duration compute agreements underscores the persistent global scarcity of high-performance AI infrastructure. Ongoing strategic alignment with major GPU hardware manufacturers continues to validate Nebius's technological platform and execution capability relative to legacy cloud providers.
Analyst commentary and positive technical momentum have helped establish a supportive floor for the stock, offsetting earlier concerns regarding high capital expenditures and capital raise dilution. Upward revisions to long-term earnings estimates reflect growing institutional confidence in the company's transition toward high-margin recurring revenue. While execution risks around physical data center deployments and broader credit market conditions remain key monitoring points, strong customer backlogs and robust prepayments provide a strong fundamental foundation supporting the stock's recent performance.
Technical Analysis of Nebius Group NV (NBIS)
Technically, Nebius Group NV (NBIS) shows a MACD (12,26,9) value of -3.319, indicating a neutral signal. The RSI at 52.127 suggests neutral condition and the Williams %R at 66.288 suggests sell condition. Please monitor closely.
Fundamental Analysis of Nebius Group NV (NBIS)
Nebius Group NV (NBIS) is in the Industrial & Commercial Services industry. Its latest annual revenue is $529.80M, ranking 113 in the industry. The net profit is $82.50M, ranking 74 in the industry. Company Profile
Over the past month, multiple analysts have rated the company as Buy, with an average price target of $279.55, a high of $410.00, and a low of $78.34.
More details about Nebius Group NV (NBIS)
Company Specific Risks:
- Massive CapEx and Revenue Disconnect: Recent analyst commentary highlighted a widening funding gap driven by Nebius's fiscal year 2026 capital expenditure guidance of $20 billion to $25 billion compared to revenue expectations of only $3.0 billion to $3.4 billion, forcing intense reliance on external capital markets.
- Equity Dilution and Surging Debt Liabilities: The company's recent issuance of $5.75 billion in accreted convertible notes alongside 15.8 million new Class A shares to exchange older debt expanded total debt above $10 billion and immediately diluted equity holders by approximately 6%.
- Aggressive Capacity Build-Out Execution Risks: Raising year-end contracted power targets to 5 gigawatts exposes Nebius to severe operational and supply chain bottlenecks, where power grid interconnect delays or hardware shortages could impede converting its $40 billion contracted backlog into profitable revenue.
- Customer Competition and Higher Neocloud Borrowing Costs: Credit markets are demanding higher interest rates to finance the neocloud compute model while key hyperscaler customers actively develop competing in-house compute solutions, threatening Nebius's long-term margins and pricing power.
Nothing in this material constitutes investment advice, personal recommendation, investment research, an offer, or a solicitation to buy or sell any financial instrument. The content has been prepared without consideration of your individual investment objectives, financial situation, or needs, and should not be treated as such.
Past performance is not a reliable indicator of future performance and/or results. Forward-looking scenarios or forecasts are not a guarantee of future performance. Actual results may differ materially from those anticipated.
Mitrade makes no representation or warranty as to the accuracy or completeness of the information provided and accepts no liability for any loss arising from reliance on such information.
Recommended Articles


