



Applied Materials Inc Stock (AMAT) Moved Up by 3.65% on Sep 21: Drivers Behind the Movement
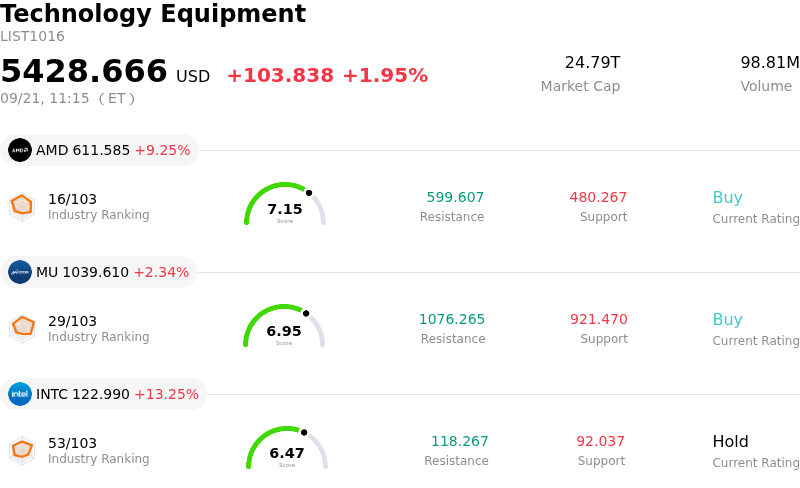
Applied Materials Inc (AMAT) moved up by 3.65%. The Technology Equipment sector is up by 1.95%. The company outperformed the industry. Top 3 stocks by turnover in the sector: Advanced Micro Devices Inc (AMD) up 9.29%; Micron Technology Inc (MU) up 2.34%; Intel Corp (INTC) up 13.24%.
What is driving Applied Materials Inc (AMAT)’s stock price up today?
Applied Materials experienced upward price movement driven by positive investor reaction to strategic corporate announcements and strong long-term growth positioning within the semiconductor capital equipment sector. Confidence has been bolstered by the company's ambitious multi-billion-dollar expansion strategy in India, which includes a major research and development campus and a significant buildout of localized supply chain capacity over the next decade. Investors view this move as a critical step toward diversifying global manufacturing footprints, enhancing research capabilities, and scaling support for next-generation semiconductor fabrication.
The broader semiconductor equipment industry continues to benefit from robust structural demand tied to artificial intelligence applications, high-bandwidth memory, and advanced packaging technologies. Applied Materials is capitalizing on high capacity utilization across leading-edge logic and memory fabs, which has catalyzed record performance in its services division. High fab utilization rates globally ensure sustained demand for recurring maintenance, fab optimization, and software solutions, underpinning revenue growth and expanding operating margins across its core business lines.
Wall Street analyst sentiment remains highly supportive, with several institutional research firms raising price targets and reaffirming buy-equivalent ratings. Analysts emphasize the company's top-tier gross margins, leading competitive moat in materials engineering, and disciplined capital allocation through share repurchases and dividend growth. Furthermore, ongoing corporate communications, such as upcoming executive investor presentations at major industry conferences, reinforce management's active engagement with the financial community. These combined factors continue to attract institutional accumulation and fuel positive intraday momentum.
Technical Analysis of Applied Materials Inc (AMAT)
Technically, Applied Materials Inc (AMAT) shows a MACD (12,26,9) value of 4.294, indicating a neutral signal. The RSI at 48.799 suggests neutral condition and the Williams %R at 21.174 suggests buy condition. Please monitor closely.
Media Coverage of Applied Materials Inc (AMAT)
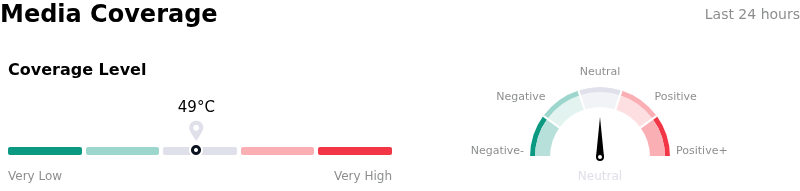
In terms of media coverage, Applied Materials Inc (AMAT) shows a coverage score of 49, indicating a moderate level of media attention. The overall market sentiment index is currently in neutral zone.
Fundamental Analysis of Applied Materials Inc (AMAT)
Applied Materials Inc (AMAT) is in the Technology Equipment industry. Its latest annual revenue is $28.37B, ranking 11 in the industry. The net profit is $7.00B, ranking 8 in the industry. Company Profile
Over the past month, multiple analysts have rated the company as Buy, with an average price target of $636.48, a high of $900.00, and a low of $308.00.
More details about Applied Materials Inc (AMAT)
Company Specific Risks:
- Multiple Compression and Valuation Overhang: Despite recent volatility, Applied Materials trades at an elevated valuation multiple near 38x earnings, prompting institutional analysts such as Mizuho to trim price targets over sector-wide multiple compression concerns, while quantitative models indicate stretched pricing relative to intrinsic fair-value estimates.
- Capital Intensity and Ramp Cost Drag: Management's long-term commitment to invest $5 billion in a 140-acre research and supply chain hub in India, combined with rapid headcount expansion of over 1,500 new hires, increases operational overhead and creates near-term margin drag during periods of sector capex uncertainty.
- Sustained Insider Selling and Spiking Short Interest: Persistent insider share liquidations by key executive leadership totaling over $180 million without any corresponding open-market insider purchases, paired with a 31.5% month-over-month increase in short interest to 15.6 million shares, reflect growing institutional skepticism.
- Geopolitical Export Control Restrictions: Tightened U.S. Commerce Department restrictions on advanced wafer fab equipment exports to China continue to limit shipment potential for high-margin logic and memory customers, while mandatory compliance auditing procedures impose recurring administrative friction.
Nothing in this material constitutes investment advice, personal recommendation, investment research, an offer, or a solicitation to buy or sell any financial instrument. The content has been prepared without consideration of your individual investment objectives, financial situation, or needs, and should not be treated as such.
Past performance is not a reliable indicator of future performance and/or results. Forward-looking scenarios or forecasts are not a guarantee of future performance. Actual results may differ materially from those anticipated.
Mitrade makes no representation or warranty as to the accuracy or completeness of the information provided and accepts no liability for any loss arising from reliance on such information.
Recommended Articles


