



Royal Caribbean Cruises Ltd Stock (RCL) Moved Down by 6.99% on Sep 22: What Signal Does It Send?
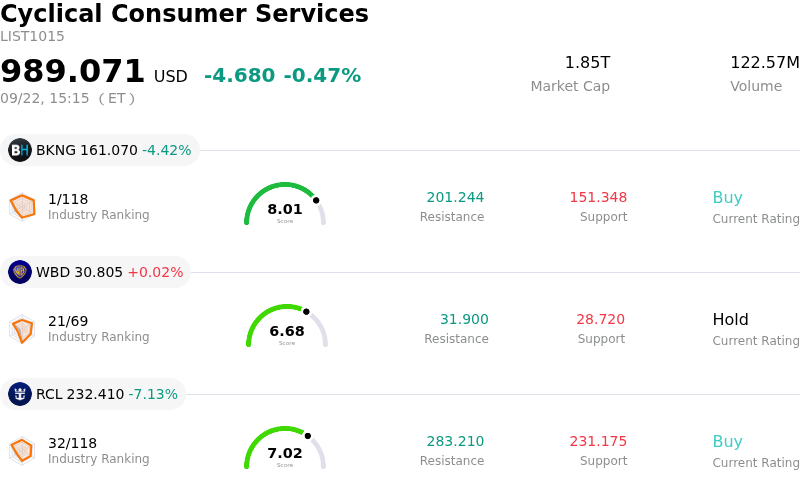
Royal Caribbean Cruises Ltd (RCL) moved down by 6.99%. The Cyclical Consumer Services sector is down by 0.47%. The company underperformed the industry. Top 3 stocks by turnover in the sector: Booking Holdings Inc (BKNG) down 4.42%; Warner Bros Discovery Inc (WBD) up 0.02%; Royal Caribbean Cruises Ltd (RCL) down 7.13%.
What is driving Royal Caribbean Cruises Ltd (RCL)’s stock price down today?
Royal Caribbean Group experienced noticeable selling pressure during the session, primarily driven by market reaction to reports regarding a potential mega-acquisition. According to media reports, the cruise operator is in advanced discussions to acquire a majority stake in Sandals Resorts International in a transaction valued at over six billion dollars. If completed, this would represent the largest acquisition in Royal Caribbean's history, giving the company controlling interest in a premier portfolio of land-based, all-inclusive Caribbean resorts. Investors responded cautiously to the headline, reflecting immediate market skepticism regarding the high valuation, execution risks, and potential balance sheet leverage needed to fund a land-based hospitality deal of this scale.
While management's strategic rationale focuses on capturing synergies between ocean cruises and land-based luxury vacations, market participants appear concerned about capital allocation priorities. Royal Caribbean has made substantial progress in deleveraging its balance sheet and generating free cash flow following post-pandemic recovery efforts. Re-engaging in large-scale M&A could divert capital away from ongoing fleet modernization, private island investments, and share repurchases or debt paydowns. Additionally, expanding into traditional resort management introduces operational complexities distinct from core cruise operations, prompting short-term uncertainty among institutional investors.
This transaction headline arrives against a backdrop of recent price consolidation for the stock after a prolonged rally. Despite the negative trading sentiment triggered by M&A news, Royal Caribbean's underlying operational trajectory remains solid. The company continues to demonstrate robust booking momentum, expanding operating margins, and resilient consumer demand for leisure travel. Forward earnings estimates reflect healthy growth expectations, supported by new ship deployments and high passenger spending. While M&A uncertainty may create short-term volatility, fundamental performance and core cruise execution will remain key long-term determinants of shareholder value.
Technical Analysis of Royal Caribbean Cruises Ltd (RCL)
Technically, Royal Caribbean Cruises Ltd (RCL) shows a MACD (12,26,9) value of -2.661, indicating a sell signal. The RSI at 21.588 suggests sell condition and the Williams %R at 97.270 suggests oversold condition. Please monitor closely.
Fundamental Analysis of Royal Caribbean Cruises Ltd (RCL)
Royal Caribbean Cruises Ltd (RCL) is in the Cyclical Consumer Services industry. Its latest annual revenue is $17.93B, ranking 7 in the industry. The net profit is $4.27B, ranking 4 in the industry. Company Profile
Over the past month, multiple analysts have rated the company as Buy, with an average price target of $346.87, a high of $425.00, and a low of $259.71.
More details about Royal Caribbean Cruises Ltd (RCL)
Company Specific Risks:
- Fuel Expense Escalation & Hedging Exposure: Sharp increases in crude oil benchmark prices pose an immediate threat to operating profitability, as Royal Caribbean's substantial unhedged fuel position (roughly 42% unhedged for fiscal 2026) directly exposes the fleet to rising operational costs and margin erosion.
- Geopolitical Disruption & Demand Softening: Ongoing Middle Eastern turmoil and cooling European itinerary demand have driven itinerary cancellations and lower booking yields, compelling management to trim full-year top-line revenue growth expectations.
- Leverage & Interest Rate Vulnerability: Carrying a net debt-to-EBITDA ratio near 2.9x–3.2x, the company remains highly sensitive to elevated bond yields and sticky interest rates, which inflate refinancing costs for its multi-billion-dollar debt load despite recent fixed-rate note issuances.
- Operational Unit Cost Growth & Margin Compression: Escalating non-fuel unit expenses and rising port operational fees outpace net yield growth, compressing adjusted EBITDA margins and raising institutional concerns over discretionary spending pullbacks.
Nothing in this material constitutes investment advice, personal recommendation, investment research, an offer, or a solicitation to buy or sell any financial instrument. The content has been prepared without consideration of your individual investment objectives, financial situation, or needs, and should not be treated as such.
Past performance is not a reliable indicator of future performance and/or results. Forward-looking scenarios or forecasts are not a guarantee of future performance. Actual results may differ materially from those anticipated.
Mitrade makes no representation or warranty as to the accuracy or completeness of the information provided and accepts no liability for any loss arising from reliance on such information.
Recommended Articles


