



Ethereum (ETHUSD) Fluctuated Significantly on Oct 23: Key Variables Behind the Move
Ethereum (ETHUSD) is up 1.24% at Oct 23 22:35(ET), now at $2410.18, with a 7-day down of 0.13%.
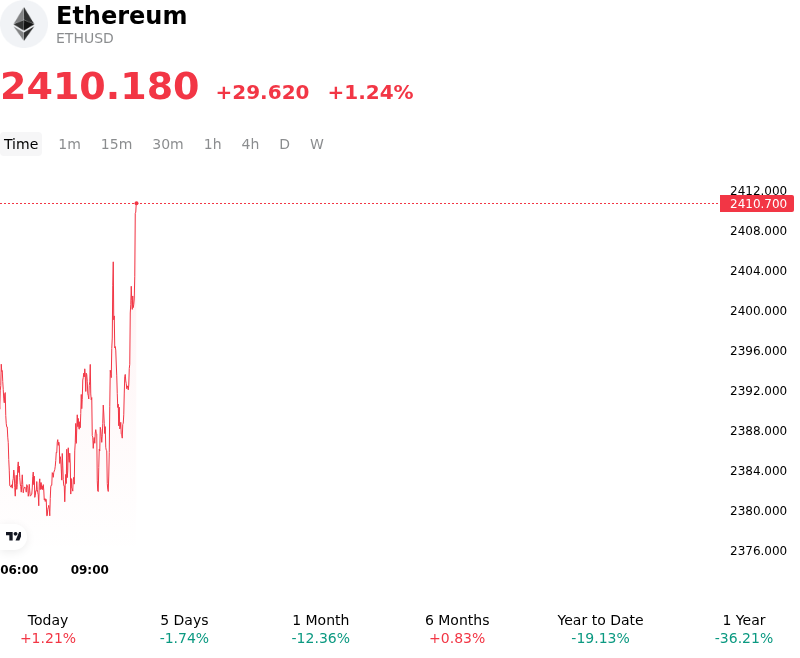
What is driving Ethereum (ETHUSD)’s stock price up today?
Ethereum recorded an upward intraday trajectory as market participants defended critical technical support levels and capital flows showed signs of stabilization following recent selling pressure. After repeated tests of structural price floors near key exponential moving averages, spot buying interest emerged to absorb sell-side liquidity. Institutional flow dynamics provided immediate relief as net redemptions across spot Ethereum exchange-traded funds moderated, with daily flow metrics turning back into positive territory. This shift in institutional positioning helped ease the persistent headwind created by earlier month-to-date ETF outflows and encouraged tactical re-entry from institutional trading desks.
On-chain capital dynamics reinforced the recovery as spot exchange reserves declined substantially, signaling that tokens were moving into self-custody rather than remaining available on exchange order books. Smart-money tracking and transaction metrics highlighted selective accumulation by major holders, including institutional portfolio rebalancing out of mature digital asset benchmarks into Ether. Concurrently, high staking participation continued to lock up a substantial portion of the circulating supply, restricting liquid market supply and amplifying the price impact of fresh buying orders.
Layer-1 ecosystem developments and protocol execution also supported baseline investor sentiment. Expectations remained anchored by technical progress on scheduled network updates, including testnet deployment phases for the Glamsterdam protocol upgrade aimed at enhancing processing efficiency and transaction finality. At the same time, macro liquidity conditions provided a less restrictive environment as moderating US Treasury yields and a consolidation in the US dollar index stabilized risk asset sentiment across global financial markets ahead of the Federal Reserve policy meeting.
Despite the intraday advance, institutional strategy desks continue to monitor several market risks. The durability of this upward trend depends on whether spot ETF inflows can demonstrate sustained positive momentum rather than single-day fluctuations. Persistent macroeconomic uncertainty, shifts in central bank interest rate expectations, and potential risk-off sentiment in broader equities could re-introduce volatility. For a structural trend reversal to take firm hold, market participants will seek confirmed daily closes above converging short-term moving average resistance.
Technical Analysis of Ethereum (ETHUSD)
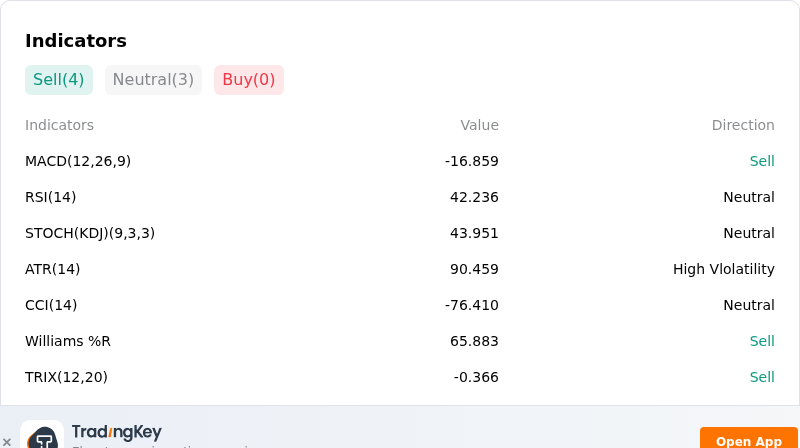
Technically, Ethereum (ETHUSD) shows a MACD (12,26,9) value of -16.859, indicating a sell signal. The RSI at 42.236 suggests neutral condition and the Williams %R at 65.883 suggests sell condition. Please monitor closely.
More details about Ethereum (ETHUSD)
Recent Events and Risks:
- Institutional Capital Outflows: U.S. spot Ethereum ETFs have suffered sustained net redemptions over consecutive trading sessions, exceeding $1 billion in total recent outflows and eliminating essential spot market buy-side liquidity.
- Leveraged Long Liquidation Cascade Threat: Derivatives market data reveals concentrated long-side leverage clustered near the key $2,350 to $2,400 price band, creating heightened exposure to cascading forced liquidations if market sellers push prices below near-term support.
- Technical Support Degradation: Continuous retests of Ethereum's 100-day Exponential Moving Average at $2,362 and the on-chain realized price near $2,311 risk triggering widespread stop-loss orders, potentially accelerating a downward move toward $2,200.
- Macro and Regulatory Pressure: Elevated U.S. Treasury yields and U.S. Dollar index strength, combined with market anxiety over the SEC's proposed Regulation Crypto Assets rules, continue to restrict risk appetite for ETH spot holdings.
Nothing in this material constitutes investment advice, personal recommendation, investment research, an offer, or a solicitation to buy or sell any financial instrument. The content has been prepared without consideration of your individual investment objectives, financial situation, or needs, and should not be treated as such.
Past performance is not a reliable indicator of future performance and/or results. Forward-looking scenarios or forecasts are not a guarantee of future performance. Actual results may differ materially from those anticipated.
Mitrade makes no representation or warranty as to the accuracy or completeness of the information provided and accepts no liability for any loss arising from reliance on such information.
Recommended Articles


