



Moderna Stock Price Forecast: Cancer Vaccine Reduces Recurrence Risk by 42% Yet Stock Drops 20%, Watch $176 Support Level
TradingKey - On October 22 US Eastern Time, Moderna (MRNA) and Merck released Phase III melanoma trial data for the personalized cancer vaccine Intismeran autogene. Following the release of the data, Moderna's stock price tumbled, closing down 20.14% at $196.31 on the day, after hitting an intraday low of $195.23. Although the data showed that the primary efficacy endpoint met expectations, why did the stock price plunge?
Why Did MRNA Stock Plunge After Phase III Cancer Vaccine Met Expectations?
The Phase III INTerpath-001 trial announced by Moderna and Merck enrolled more than 1,100 patients. Results showed that the personalized mRNA cancer vaccine Intismeran autogene combined with Keytruda reduced the risk of melanoma recurrence or death by 42% and the risk of distant metastasis or death by 38% compared with Keytruda alone. Approximately 82.2% of patients in the combination therapy group remained cancer-free after two years, compared with 70% in the Keytruda monotherapy group.
From the clinical results themselves, the primary endpoint met expectations, and multiple institutions gave positive evaluations of the data. However, MRNA had experienced a sharp run-up prior to the announcement, with its stock up more than 500% at one point this year. As Reuters pointed out, the decline on October 22 was largely a classic case of "sell the news," while the market began refocusing on the therapy's actual commercial scope.
For investors, three key points warrant attention. First, overall survival (OS) data remains immature and requires further follow-up data for confirmation; second, the company plans to apply for approval from U.S. regulators targeting a 2027 market launch, where the approval timeline and final label scope will affect the potential market size; third, Intismeran is currently being tested in indications such as lung, kidney, and bladder cancers, so whether it can replicate its melanoma results in the future will impact the market's assessment of the long-term value of Moderna's oncology business.
Moderna Stock Price Technical Analysis
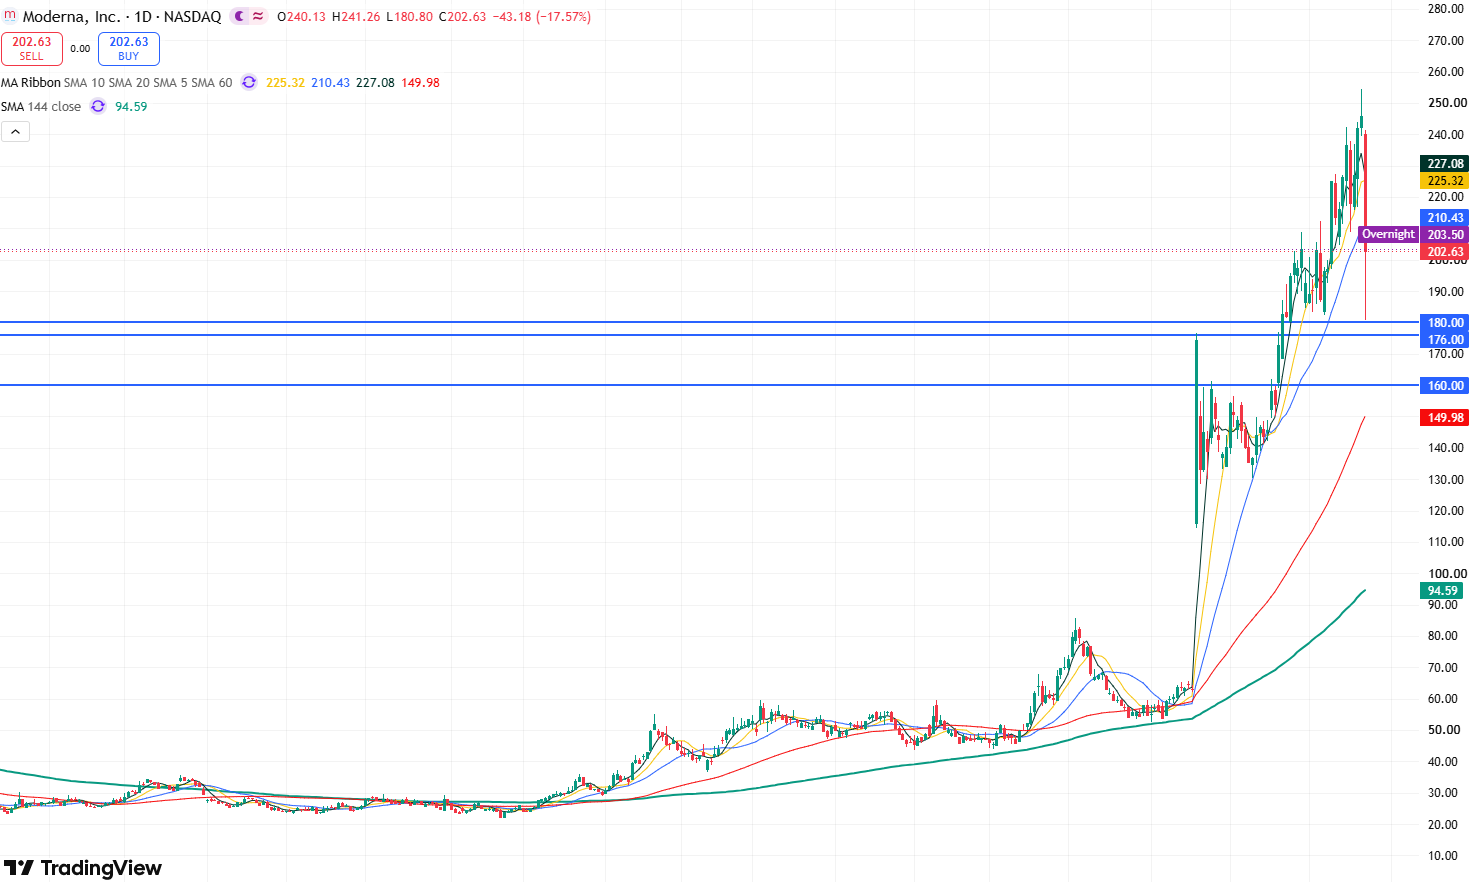
Moderna daily stock chart, Source: TradingView
Looking at Moderna's daily stock chart, the stock plunged over 17% on Thursday, briefly breaking below its 5-day, 10-day, and 20-day moving averages. This indicates that the market's short-term bullish structure has been damaged and short-term bearish momentum has significantly strengthened. However, the stock closed the day with a long lower shadow, suggesting that short-term selling pressure may have been somewhat absorbed, with buying support remaining below.
Regarding technical indicators, the Relative Strength Index (RSI) hovers around 51, remaining in moderately bullish territory. Meanwhile, the 60-day and 144-day moving averages maintain a bullish alignment, indicating that the stock's medium-term trend remains bullish.
Currently, the stock rebounded quickly after touching the $180 support level intraday on Thursday, showing that this level provides certain support. However, with the 20-day moving average breached, further downside potential remains in the short term. If the stock breaks below $180, it may test the key support level at $176. If this level is lost, the stock could further fall back toward $160.
Conversely, if the stock stops falling and stabilizes above the $176-$180 support range, it will continue its short-term uptrend, testing resistance near $250, close to its all-time high of $254.48.
Nothing in this material constitutes investment advice, personal recommendation, investment research, an offer, or a solicitation to buy or sell any financial instrument. The content has been prepared without consideration of your individual investment objectives, financial situation, or needs, and should not be treated as such.
Past performance is not a reliable indicator of future performance and/or results. Forward-looking scenarios or forecasts are not a guarantee of future performance. Actual results may differ materially from those anticipated.
Mitrade makes no representation or warranty as to the accuracy or completeness of the information provided and accepts no liability for any loss arising from reliance on such information.
Recommended Articles


