



Apple Stock Price Forecast: AAPL Continues Pullback After Record High, Will It Test $300 Again This Year?
Apple 2026 Stock Performance Review
TradingKey - 2026 was a landmark year for Apple Inc. (AAPL) marked by milestones and strong stock performance. Driven by on-device AI deployment, robust sales of the iPhone 17 series, and hardware-software ecosystem upgrades, the company's stock price overcame early-year macroeconomic volatility to achieve a strong one-way upward trend during the year, breaking historical records in mid-October and briefly crossing the $5.0 trillion market capitalization mark.
From January to March this year, Apple's stock price mainly fluctuated in a wide range of $240–$280; from April to June, AAPL broke out of the consolidation pattern and surpassed the $300 mark; from July to September, Apple's stock price gains slowed noticeably, but still maintained an upward trajectory and broke above $340; in October, the stock price launched a new rally and hit an all-time high of $348.15 on October 13.
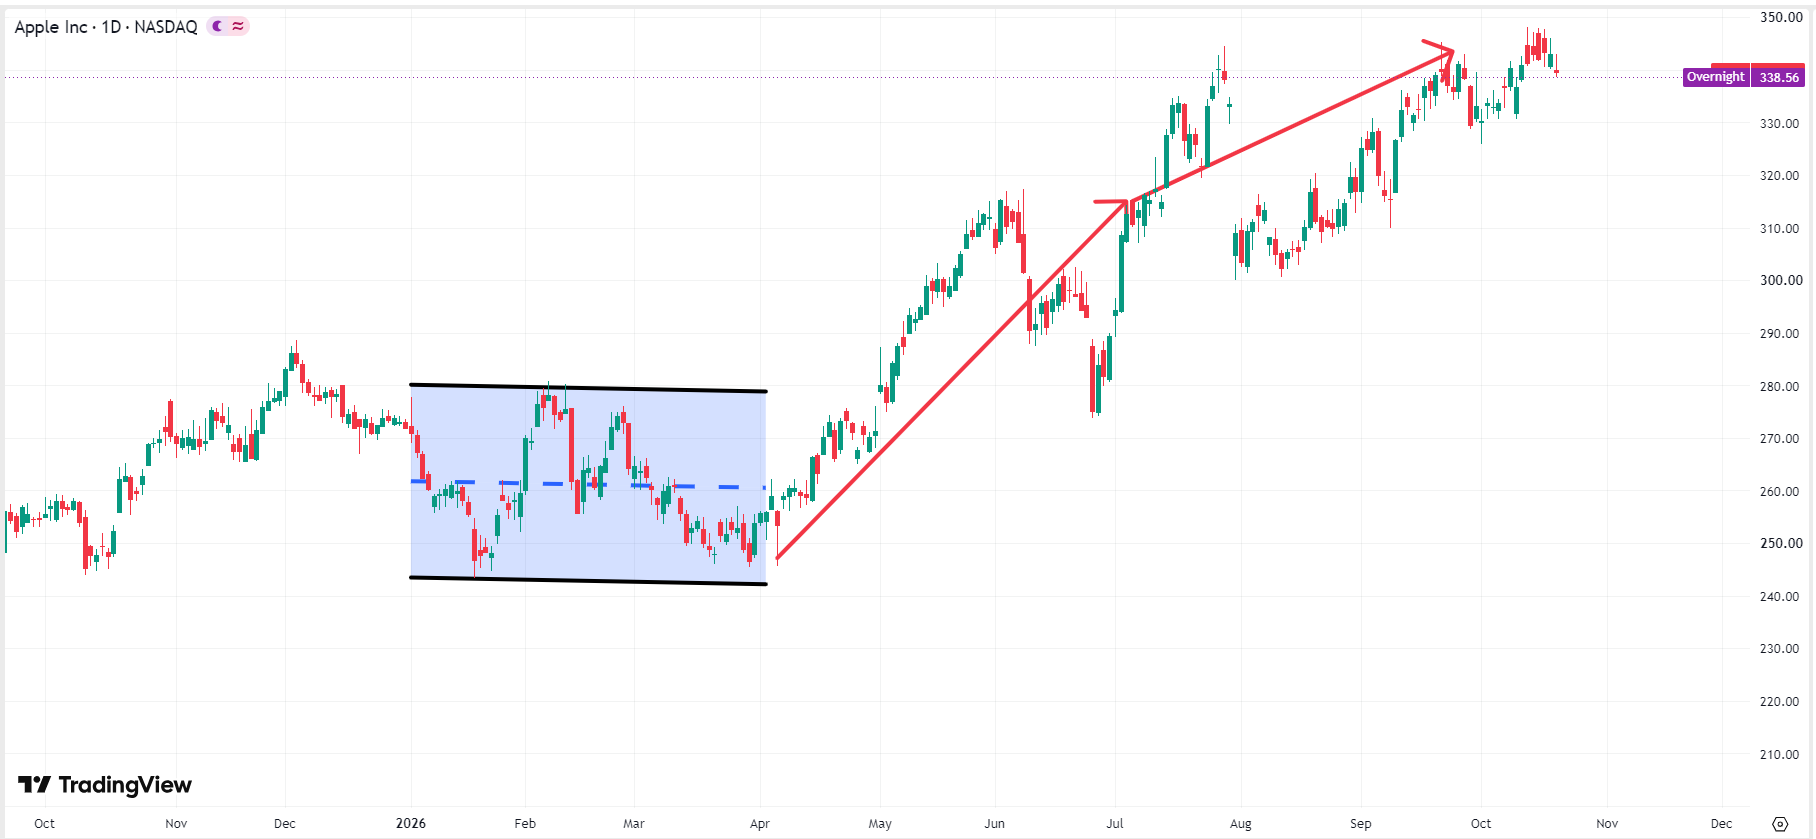 Apple stock price chart, Source: TradingView
What Factors Affect Apple's Stock Price Volatility?
In early 2026, Apple's stock price maintained high-level volatility, mainly affected by macro inflation shocks and Federal Reserve interest rate decisions. Tech stocks across the market faced short-term deleveraging pressure, and public market capital was closely watching Apple's path to commercial monetization in the on-device AI space.
In the second quarter, Apple's stock price experienced a significant rally, primarily because Q2 earnings far exceeded expectations, combined with management's announcement of a massive $100 billion-level share buyback program that significantly boosted market confidence. Furthermore, at WWDC 2026, Apple demonstrated a new-generation Siri agent deeply integrated with macOS and iOS, as well as a private cloud computing architecture, sparking immense capital market expectations for a hardware supercycle.
Heading into the third quarter, global pre-order figures for the all-new iPhone 17 series exceeded expectations, driving up both the average selling price and hardware gross margin. Moreover, the market viewed Apple Intelligence as an exclusive, closed-loop software and hardware ecosystem, pushing up the valuation premium for the services business.
Will Apple Stock Fall Further This Year?
After surging to an all-time high of $348.15 and briefly crossing the $5 trillion market cap milestone, Apple's stock price has recently continued to pull back below $340. In the short term, affected by macroeconomic headwinds and pre-event wait-and-see sentiment, there remains a risk of a modest downward shakeout.
U.S. September CPI (3.7%) and PPI (MoM +1.3%) came in higher than expected, triggering a sharp rebound in U.S. Treasury yields. In a high-interest-rate environment, high-P/E tech giants across the market generally face deleveraging selling pressure from valuation recalibration, while Apple's current P/E of around 38.9x remains at a relatively high level, meaning downside risks have not yet been cleared.
Apple is about to hold its "Pro and Tell" product launch event on October 28 and report its Q4 financial results on November 2. Ahead of these two major announcements, some short-term profit-takers and quantitative algorithmic funds tend to reduce leverage and lock in gains, unless major positive news emerges to attract capital inflows.
Where Is Apple's Next Line of Defense?
From a technical analysis perspective, if the broader market continues its short-term volatile pullback, Apple's first line of defense lies in the $320–$330 range. This is the midline of its high-level consolidation over the past three months, as well as the cost basis zone where long-term institutional capital and quantitative funds built up concentrated positions ahead of the autumn launch event. If the market weakness is merely a normal deleveraging shakeout driven by a macro jump in U.S. Treasury yields, the stock has a higher probability of finding support and rebounding here. However, if Apple itself encounters negative developments, the stock price may continue downward to search for another line of defense.
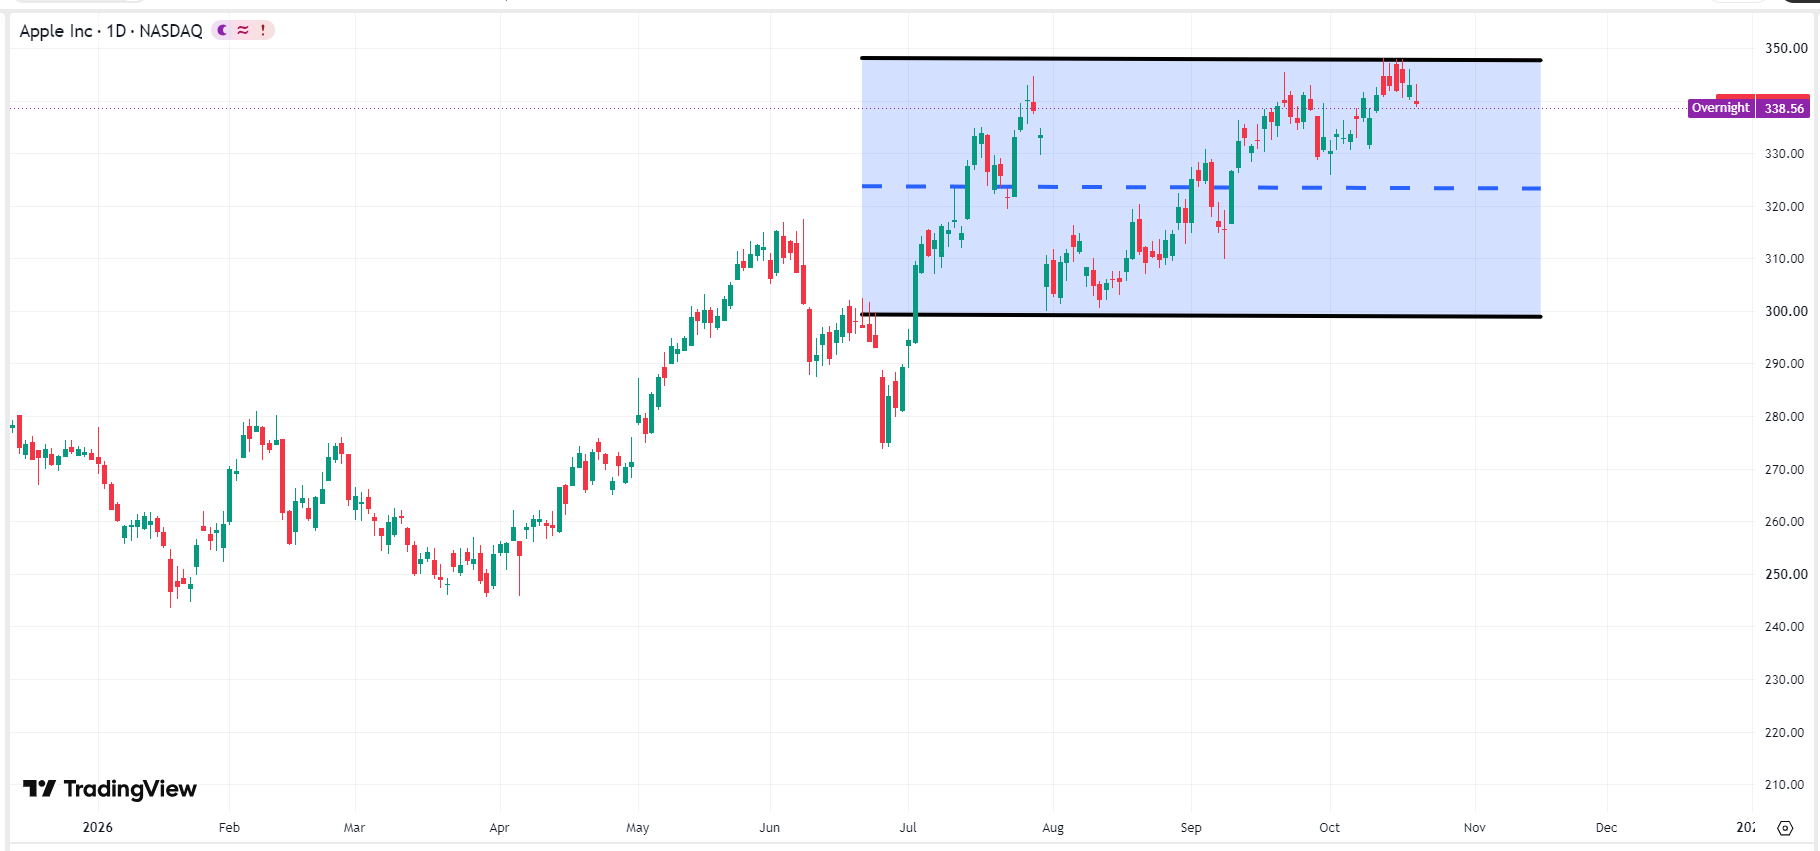 Apple stock price chart, Source: TradingView
Apple's second support level lies near $300, serving not only as a psychological round-number mark and a 200-day moving average defense line, but also as the lower bound of the third-quarter consolidation. This position represents an ideal defensive position for institutional buying to drive valuation recovery, and will likely be tested only under extreme circumstances.
Nothing in this material constitutes investment advice, personal recommendation, investment research, an offer, or a solicitation to buy or sell any financial instrument. The content has been prepared without consideration of your individual investment objectives, financial situation, or needs, and should not be treated as such.
Past performance is not a reliable indicator of future performance and/or results. Forward-looking scenarios or forecasts are not a guarantee of future performance. Actual results may differ materially from those anticipated.
Mitrade makes no representation or warranty as to the accuracy or completeness of the information provided and accepts no liability for any loss arising from reliance on such information.
Recommended Articles


