



Silver Price Forecast: US Inflation Pressures Heat Up as $55 Level Lost, Is Silver's Next Target $50?
TradingKey - As of October 22, silver prices (XAGUSD) plunged 5.82% on the day, hitting an intraday low of $54.48 and closing at $54.57, meaning the key support level of $55 was lost, opening up further downside room for silver prices. Inflation concerns triggered by rising international oil prices, alongside expectations of further Fed rate hikes by the end of the year, were the main factors weighing on silver prices.
Rising Oil Prices Heighten Inflation Fears
From a fundamental perspective, the key factor driving silver prices recently has been oil prices.
Tensions in the Middle East have flared up again recently. Yemen's Houthi rebels launched a new round of attacks on Saudi energy facilities, sparking market concerns over crude oil supply disruptions in the Middle East and pushing Brent crude prices to their highest level since May.
Rising oil prices further heighten the risk of persistently elevated US inflation. Previously released US September CPI and PPI data both came in higher than market expectations, with rising energy prices serving as a key driver behind the inflation rebound. Persistent price pressures mean the Federal Reserve may need to keep interest rates higher for longer, thereby increasing the opportunity cost of holding non-yielding silver.
According to the CME FedWatch Tool, the market generally expects the Federal Reserve to keep interest rates unchanged at its October 27-28 meeting, but the probability of a 25-basis-point rate hike in December remains at around 86%. In addition, the US PCE inflation data, a key focus for the Fed, will be released on October 29, and the results could further influence market expectations regarding the rate path by the end of the year.
Silver Price Technical Analysis
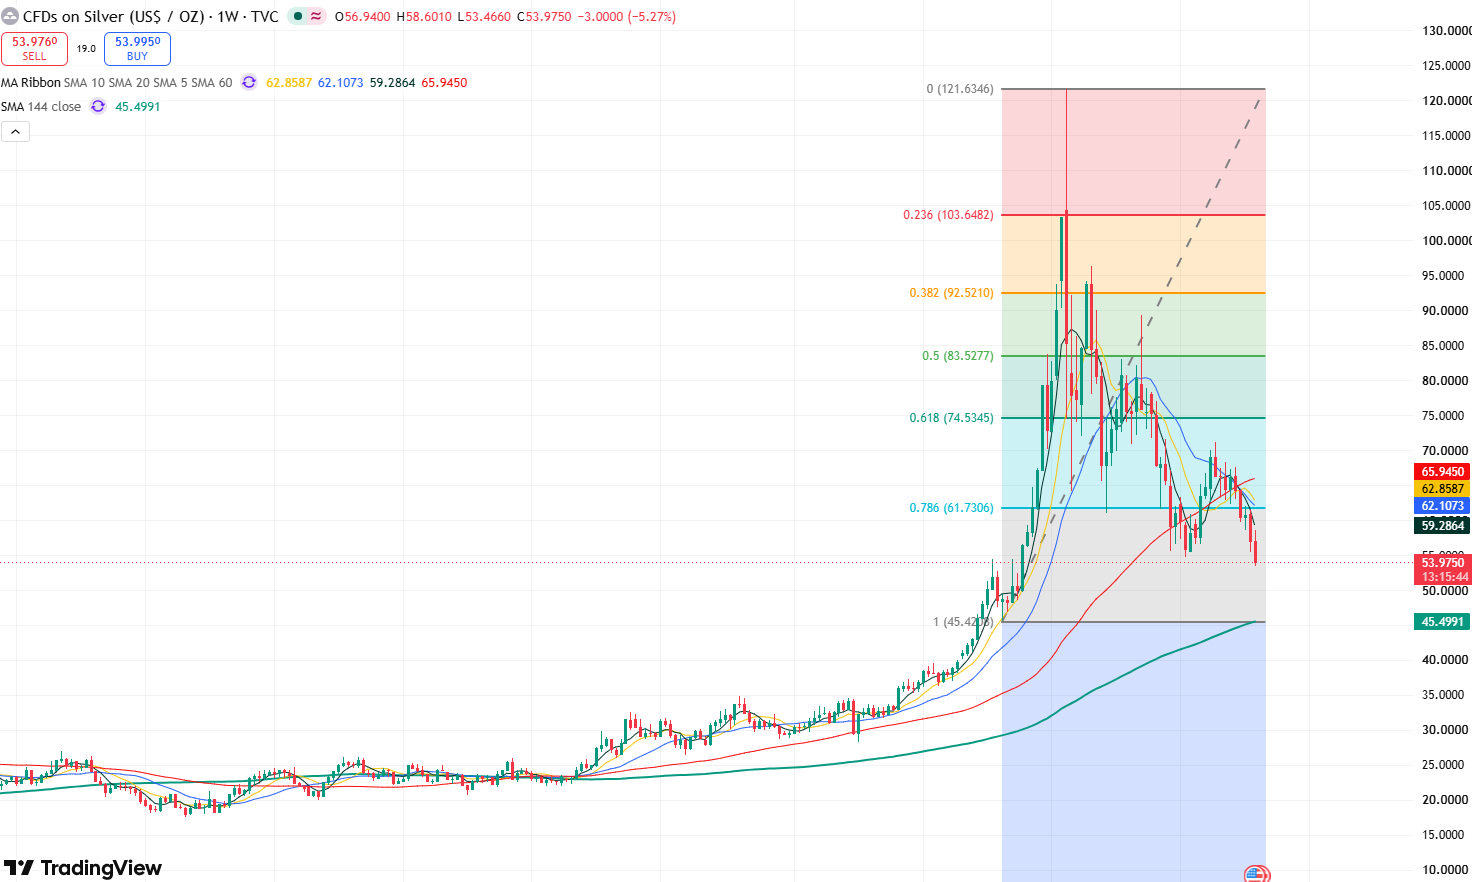
Silver price weekly chart, Source: TradingView
Looking at silver's weekly chart, after reaching an all-time high of $121.64 earlier this year, prices have continued to pull back. As the peaks of recent rebounds have progressively lowered, the candlestick pattern shows a consistent trend of lower highs and lower lows, indicating that silver's overall trajectory remains downward.
Currently, silver has broken below key support at $55, with the lows of the overall candlestick trend moving lower once again. This indicates that the broader downtrend is continuing, opening up space for deeper downside. The first level to watch is $50; if this level fails to hold, silver prices may drop further toward the $45 area.
To the upside, if silver reclaims $55, a double bottom pattern may form on the weekly chart, significantly bolstering bullish momentum and potentially driving prices to test the $60 mark. A decisive break and hold above $60 would see silver challenge its previous rebound high of $71.16.
Nothing in this material constitutes investment advice, personal recommendation, investment research, an offer, or a solicitation to buy or sell any financial instrument. The content has been prepared without consideration of your individual investment objectives, financial situation, or needs, and should not be treated as such.
Past performance is not a reliable indicator of future performance and/or results. Forward-looking scenarios or forecasts are not a guarantee of future performance. Actual results may differ materially from those anticipated.
Mitrade makes no representation or warranty as to the accuracy or completeness of the information provided and accepts no liability for any loss arising from reliance on such information.
Recommended Articles


