



Ethereum (ETHUSD) Is down 1.00% on Oct 24: What Do On-Chain Data and Market Sentiment Show?
Ethereum (ETHUSD) is down 1.00% at Oct 24 21:10(ET), now at $2375.15, with a 7-day down of 1.82%.
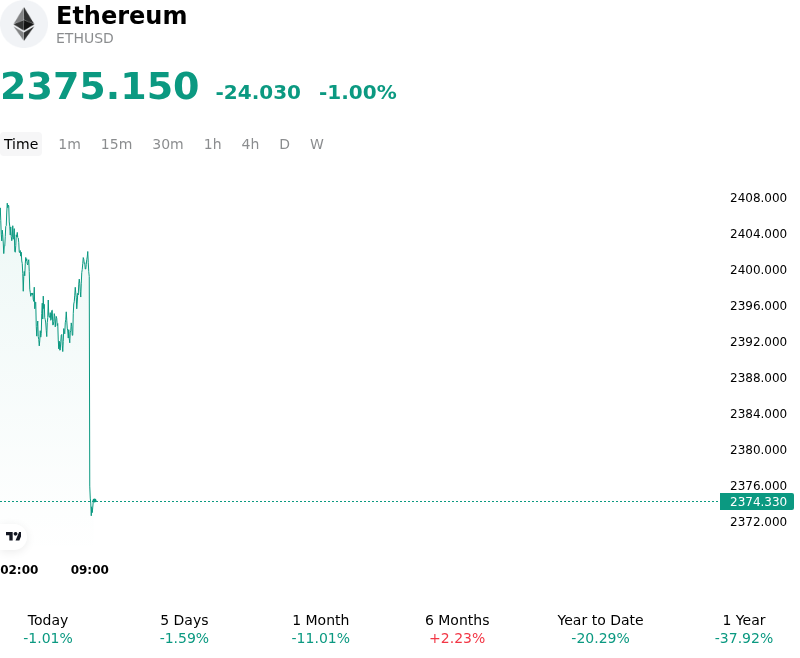
What is driving Ethereum (ETHUSD)’s stock price down today?
Elevated U.S. Treasury yields and ongoing macroeconomic uncertainty continued to pressure risk-sensitive digital assets, driving market participants to reduce exposure to high-beta tokens like Ethereum. Tightening financial conditions and persistent inflation concerns bolstered real yields, attracting institutional capital into sovereign debt instruments and reducing short-term risk appetite across broader financial markets. In addition, institutional momentum via spot Ether exchange-traded funds has remained muted following a period of net monthly redemptions. The lack of sustained spot ETF buying removed a key structural tailwind, leaving spot order books vulnerable to incremental selling pressure from institutional rebalancing.
Derivatives market dynamics further accelerated the downward momentum during the trading session. Ethereum faced technical resistance near its short-term exponential moving averages, failing to sustain upward momentum and triggering localized long liquidations in perpetual futures markets. As key short-term price levels were breached, automated stop-loss orders and deleveraging by leveraged market participants added downside friction, shifting market microstructure toward derivative-led selling.
On-chain indicators highlight a market characterized by near-term liquidity constraints despite solid underlying network security. While long-term staking metrics remain robust—with a substantial portion of total circulating supply locked in validator contracts—immediate spot availability was impacted by selective profit-taking from early holders. Furthermore, minor timing adjustments across protocol testnet deployments moderated short-term speculative enthusiasm, leading swing traders to adopt a more conservative stance.
The recent price action reflects a temporary macro-led liquidity repricing and leverage unwind rather than a fundamental erosion of Ethereum's layer-one utility. Investors and portfolio managers are closely watching global macro liquidity conditions, U.S. Federal Reserve policy signals, and the stabilization of spot ETF flows as critical precursors for renewed capital deployment into smart contract platforms.
Technical Analysis of Ethereum (ETHUSD)
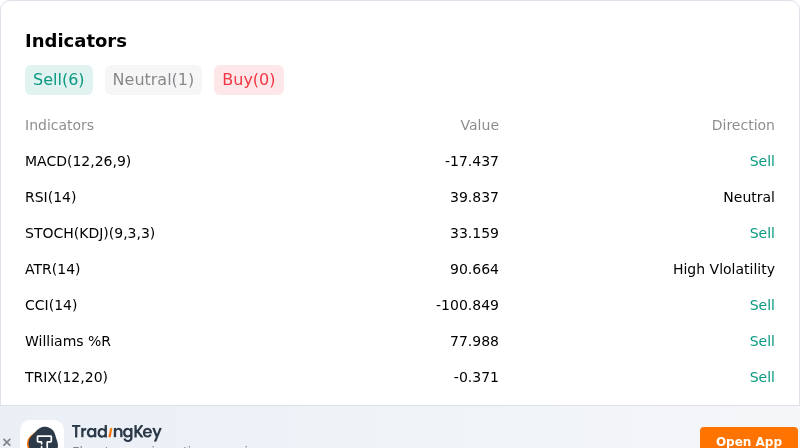
Technically, Ethereum (ETHUSD) shows a MACD (12,26,9) value of -17.437, indicating a sell signal. The RSI at 39.837 suggests neutral condition and the Williams %R at 77.988 suggests sell condition. Please monitor closely.
More details about Ethereum (ETHUSD)
Recent Events and Risks:
- Institutional Spot ETF Outflows: Sustained redemptions from U.S. spot Ethereum ETFs—highlighted by recent single-day net withdrawals exceeding $110 million and multi-week redemptions topping $319 million—have eroded vital spot market buy-side liquidity and severely weakened institutional sentiment.
- Derivatives Liquidation Cascades: Heavy concentration of leveraged long positions near the critical $2,350 to $2,400 support cluster leaves ETH highly susceptible to cascading forced sell-offs if market pressure breaks key technical floors.
- Protocol Upgrade Delay and Security Concerns: Core developers postponed the Hoodi testnet activation for the Glamsterdam upgrade to analyze potential smart-contract compatibility risks and security issues associated with EIP-8037, adding technical uncertainty.
- Whale Offloading and Exchange Inflows: On-chain tracking reported early investors and whale addresses depositing thousands of ETH to centralized exchange wallets, adding substantial spot-side supply pressure during periods of thin market liquidity.
Nothing in this material constitutes investment advice, personal recommendation, investment research, an offer, or a solicitation to buy or sell any financial instrument. The content has been prepared without consideration of your individual investment objectives, financial situation, or needs, and should not be treated as such.
Past performance is not a reliable indicator of future performance and/or results. Forward-looking scenarios or forecasts are not a guarantee of future performance. Actual results may differ materially from those anticipated.
Mitrade makes no representation or warranty as to the accuracy or completeness of the information provided and accepts no liability for any loss arising from reliance on such information.
Recommended Articles


