



Newmont Corporation Stock (NEM) Moved Down by 3.77% on Oct 23: Key Drivers Unveiled
Newmont Corporation (NEM) moved down by 3.77%. The Mineral Resources sector is down by 0.53%. The company underperformed the industry. Top 3 stocks by turnover in the sector: Newmont Corporation (NEM) down 3.78%; Freeport-McMoRan Inc (FCX) up 0.77%; Barrick Mining Ord Shs (B) down 1.34%.
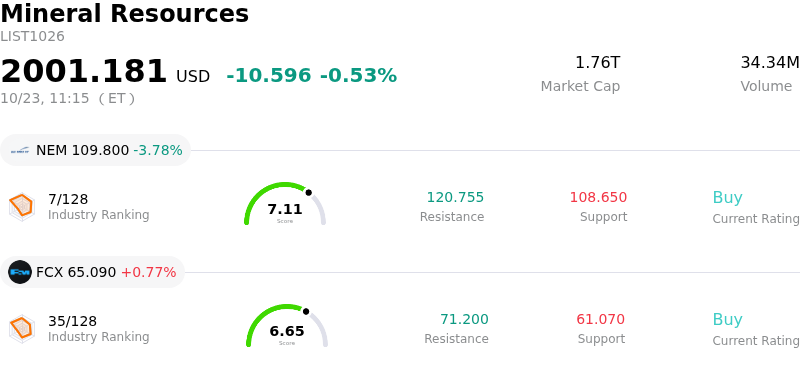
What is driving Newmont Corporation (NEM)’s stock price down today?
Newmont Corporation experienced notable downward volatility despite reporting third-quarter financial results that topped Wall Street estimates. The gold mining giant delivered solid revenue and adjusted earnings per share that comfortably surpassed consensus expectations, supported by strong realized bullion prices and operational recoveries at major assets such as the Cadia facility. Management also reaffirmed its full-year production targets while lowering its full-year all-in sustaining cost guidance, reflecting operational execution and robust free cash flow generation.
However, the positive headline beat was overshadowed by heightened market scrutiny around cost inflation and near-term operating challenges. Wall Street sentiment grew cautious as analysts downgraded the stock and reduced price forecasts, highlighting cost pressures across Australian mining operations and ongoing operational execution risks at key sites like Lihir. Furthermore, investors reacted to a sequential decline in realized gold prices compared to the prior quarter, alongside a sequential contraction in free cash flow driven by working-capital outflows and increased capital expenditure. Market participants also digested upcoming cash commitments, including a significant financial settlement tied to the amended Nevada Gold Mines joint venture agreement with Barrick.
From a broader market perspective, profit-taking contributed to the decline as institutional investors rebalanced positions following strong overall performance across precious metals equities. Despite Newmont's ongoing capital return efforts via dividends and active share buybacks, valuation sensitivity and lingering concerns over late-year cost inflation led market participants to lock in gains, driving intraday selling pressure across the stock and the broader gold mining sector.
Technical Analysis of Newmont Corporation (NEM)
Technically, Newmont Corporation (NEM) shows a MACD (12,26,9) value of -0.574, indicating a sell signal. The RSI at 37.163 suggests neutral condition and the Williams %R at 85.350 suggests oversold condition. Please monitor closely.
Fundamental Analysis of Newmont Corporation (NEM)
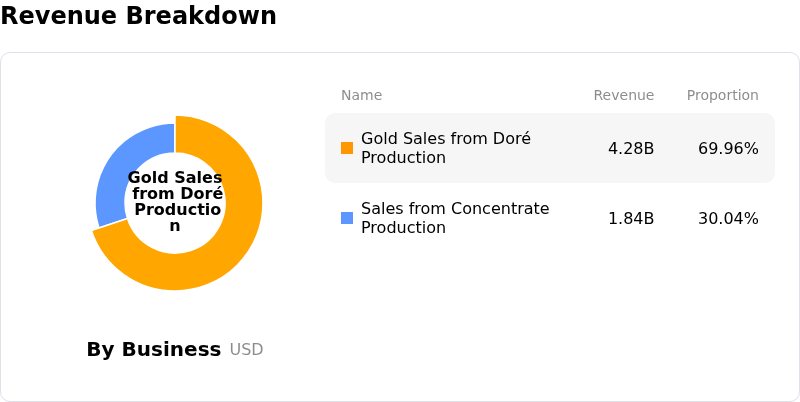
Newmont Corporation (NEM) is in the Mineral Resources industry. Its latest annual revenue is $22.67B, ranking 10 in the industry. The net profit is $7.08B, ranking 3 in the industry. Company Profile
Over the past month, multiple analysts have rated the company as Buy, with an average price target of $140.59, a high of $205.00, and a low of $79.00.
More details about Newmont Corporation (NEM)
Company Specific Risks:
- Wall Street Downgrades and Lowered EBITDA Projections: Freedom Broker downgraded Newmont from Buy to Hold with a reduced price target of $116, highlighting that the company presents the least favorable balance of earnings growth, operational risk, and valuation upside relative to sector peers.
- Sharp Q4 All-In Sustaining Cost Surge: Despite beating Q3 expectations, management projected fourth-quarter All-In Sustaining Costs (AISC) to spike to approximately $1,900 per ounce, driven by fuel cost inflation across Australian mines and an estimated 30% decline in silver co-product credits at Peñasquito.
- Asset-Level Operational and Execution Risks: Lingering operational performance risks at major assets, particularly Lihir and Cadia, led analysts to slash 2027 EBITDA estimates by 16% while raising concerns over capital-intensive execution requirements for projects like the Red Chris block cave expansion.
- Substantial Short-Term Capital Outflows: Newmont faces immediate liquidity commitments, including a $1.95 billion cash payment due to Barrick Mining Corp. in Q4 2026 under the amended Nevada Gold Mines joint venture agreement, alongside a projected $500 million increase in 2027 development capital expenditures.
Nothing in this material constitutes investment advice, personal recommendation, investment research, an offer, or a solicitation to buy or sell any financial instrument. The content has been prepared without consideration of your individual investment objectives, financial situation, or needs, and should not be treated as such.
Past performance is not a reliable indicator of future performance and/or results. Forward-looking scenarios or forecasts are not a guarantee of future performance. Actual results may differ materially from those anticipated.
Mitrade makes no representation or warranty as to the accuracy or completeness of the information provided and accepts no liability for any loss arising from reliance on such information.
Recommended Articles


