



Novartis AG Stock (NVS) Moved Down by 3.61% on Oct 23: Facts Behind the Movement
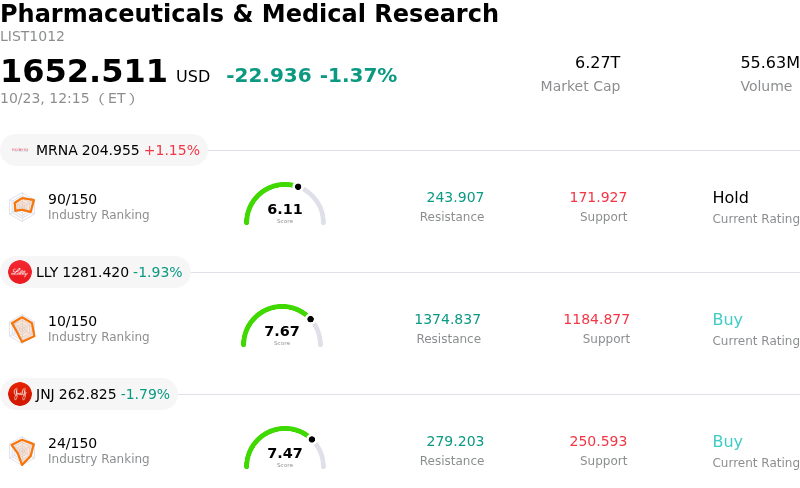
Novartis AG (NVS) moved down by 3.61%. The Pharmaceuticals & Medical Research sector is down by 1.37%. The company underperformed the industry. Top 3 stocks by turnover in the sector: Moderna Inc (MRNA) up 1.57%; Eli Lilly and Co (LLY) down 1.93%; Johnson & Johnson (JNJ) down 1.79%.
What is driving Novartis AG (NVS)’s stock price down today?
Novartis AG experienced downward price action and elevated intraday volatility, primarily driven by broader market risk-off sentiment and cautious position adjustments ahead of its upcoming quarterly earnings release. Global equity indices faced broader selling pressure, which extended into large-cap healthcare and pharmaceutical equities. At the same time, market participants trimmed exposure as investors re-evaluated commercial growth projections amid ongoing structural revenue headwinds for key legacy blockbusters, particularly Entresto, which faces increasing patent expiry and generic entry pressures.
Recent pipeline updates and clinical presentations also factored heavily into intraday sentiment. Novartis held dedicated investor discussions while presenting detailed Phase III trial data for remibrutinib in relapsing multiple sclerosis at the joint MSToronto conference, alongside long-term six-year survival data for Kisqali at the ESMO congress. While clinical data confirmed therapeutic efficacy, market expectations remained high. In the wake of earlier R&D setbacks, including the recent discontinuation of a mid-stage trial for Fabhalta in lupus nephritis, several institutional investors opted to take profits and manage risk rather than expand positions following the clinical readouts.
Looking forward, institutional focus centers on the company's ability to replace mature revenue streams through newly authorized products such as Rhapsido and the continued global rollout of its expanded immunology and oncology franchises. With consensus analyst sentiment leaning cautious ahead of the upcoming financial results, near-term share price direction will largely depend on executive commentary regarding full-year margin targets, commercial scaling for newly launched therapies, and forward guidance on pipeline delivery.
Technical Analysis of Novartis AG (NVS)
Technically, Novartis AG (NVS) shows a MACD (12,26,9) value of 2.538, indicating a buy signal. The RSI at 55.996 suggests neutral condition and the Williams %R at 36.679 suggests buy condition. Please monitor closely.
Fundamental Analysis of Novartis AG (NVS)
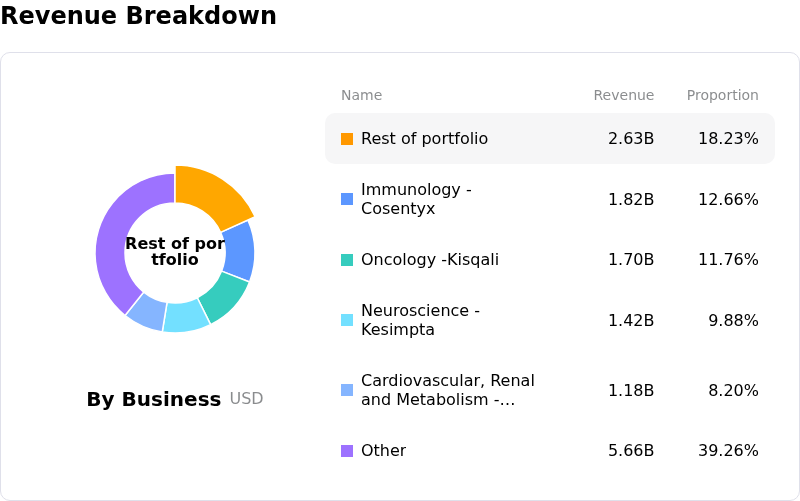
Novartis AG (NVS) is in the Pharmaceuticals & Medical Research industry. Its latest annual revenue is $56.33B, ranking 9 in the industry. The net profit is $13.98B, ranking 5 in the industry. Company Profile
Over the past month, multiple analysts have rated the company as Hold, with an average price target of $153.26, a high of $185.00, and a low of $121.16.
More details about Novartis AG (NVS)
Company Specific Risks:
- Pipeline Strategic Setbacks: Novartis recently discontinued its Phase 2 clinical trial evaluating iptacopan (Fabhalta) in lupus nephritis due to strategic considerations and trial performance, dampening investor expectations for expanding its high-margin renal and immunology drug pipeline.
- Entresto Patent Erosion and Top-Line Headwinds: Institutional analysts are voicing concern over sharp revenue declines in core cardiovascular treatments, with U.S. Entresto sales dropping significantly year-over-year due to generic competition, creating revenue compression ahead of earnings.
- Shareholder Litigation and Disclosure Investigations: The company faces active securities fraud investigations from class-action law firms following the failed Phase III HARBOR study of del-desiran, maintaining legal overhang and heightened regulatory disclosure scrutiny.
- Sequential Earnings Compression Concerns: Wall Street consensus forecasts Q3 2026 earnings per share of $2.25, down from $2.41 in the prior quarter, driving institutional caution and position trimming ahead of the upcoming earnings report.
Nothing in this material constitutes investment advice, personal recommendation, investment research, an offer, or a solicitation to buy or sell any financial instrument. The content has been prepared without consideration of your individual investment objectives, financial situation, or needs, and should not be treated as such.
Past performance is not a reliable indicator of future performance and/or results. Forward-looking scenarios or forecasts are not a guarantee of future performance. Actual results may differ materially from those anticipated.
Mitrade makes no representation or warranty as to the accuracy or completeness of the information provided and accepts no liability for any loss arising from reliance on such information.
Recommended Articles


