



Ge Vernova Inc Stock (GEV) Moved Up by 3.02% on Oct 29: A Full Analysis
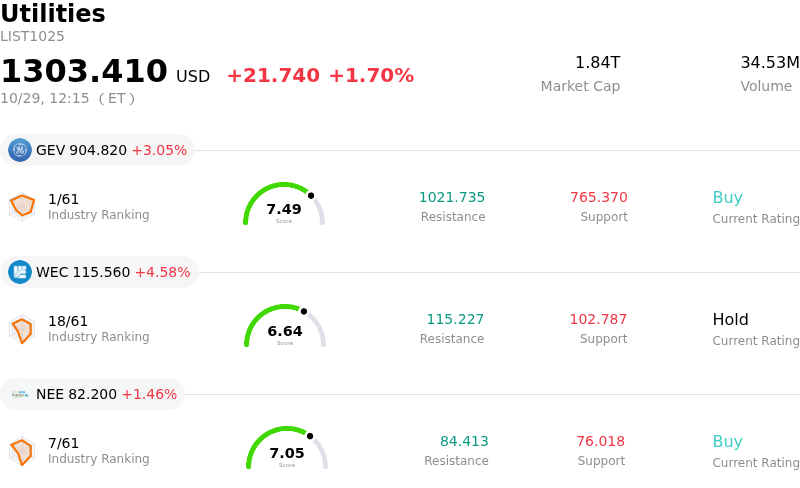
Ge Vernova Inc (GEV) moved up by 3.02%. The Utilities sector is up by 1.70%. The company outperformed the industry. Top 3 stocks by turnover in the sector: Ge Vernova Inc (GEV) up 3.05%; WEC Energy Group Inc (WEC) up 4.62%; Nextera Energy Inc (NEE) up 1.46%.
What is driving Ge Vernova Inc (GEV)’s stock price up today?
GE Vernova experienced notable upward price momentum amidst elevated trading volume following the release of its third-quarter financial results, which comfortably exceeded market expectations on both top and bottom lines. The performance was anchored by extraordinary demand across power generation and grid infrastructure, largely propelled by accelerating capital expenditure from utilities and data center operators supporting artificial intelligence infrastructure. Total quarter order intake nearly doubled compared to the prior-year period, pushing the company's backlog to a record level nearing two hundred billion dollars and providing multi-year visibility into future revenue streams.
Compounding the positive fundamental backdrop, management raised its full-year guidance across key operational metrics, including revenue, adjusted EBITDA margins, and free cash flow. Management also demonstrated aggressive capital allocation discipline by doubling its share buyback authorization to twenty billion dollars, backed by a cash balance of seventeen billion dollars. Furthermore, the announced nine billion dollar strategic acquisition of Trench Group is expected to strengthen the company’s high-voltage grid equipment portfolio, directly expanding its footprint in critical electrification supply chains.
While the session exhibited heightened intraday volatility as market participants initially weighed cost drag in the wind energy segment alongside M&A execution considerations, buying pressure quickly resumed as institutions focused on long-term structural tailwinds. Strong margin expansion in the core Power and Electrification divisions, combined with analyst price target adjustments and robust institutional order flow, ultimately sustained the stock's upward trajectory.
Technical Analysis of Ge Vernova Inc (GEV)
Technically, Ge Vernova Inc (GEV) shows a MACD (12,26,9) value of -9.713, indicating a sell signal. The RSI at 47.244 suggests neutral condition and the Williams %R at 48.276 suggests neutral condition. Please monitor closely.
Media Coverage of Ge Vernova Inc (GEV)
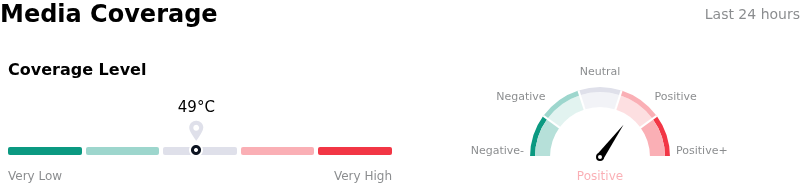
In terms of media coverage, Ge Vernova Inc (GEV) shows a coverage score of 49, indicating a moderate level of media attention. The overall market sentiment index is currently in bullish zone.
Fundamental Analysis of Ge Vernova Inc (GEV)
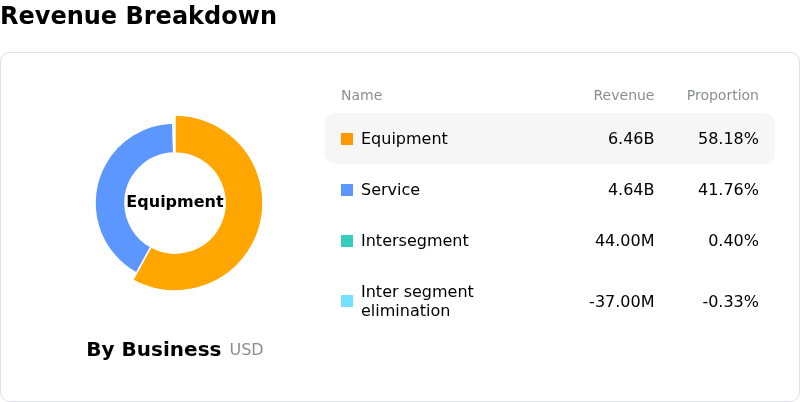
Ge Vernova Inc (GEV) is in the Utilities industry. Its latest annual revenue is $38.07B, ranking 2 in the industry. The net profit is $4.88B, ranking 4 in the industry. Company Profile
Over the past month, multiple analysts have rated the company as Buy, with an average price target of $1133.66, a high of $1424.00, and a low of $300.00.
More details about Ge Vernova Inc (GEV)
Company Specific Risks:
- Acquisition Leverage and Integration Risk: Following the announcement of the $9 billion acquisition of Trench Group, market concern has centered on the $4.5 billion in new debt financing required for the deal, which introduces elevated interest expenses, long regulatory approval timelines extending through late 2027, and substantial integration execution risks.
- Persistent Wind Segment EBITDA Losses: Despite strong overall third-quarter results, the Wind segment remains an operational drag, with nine-month segment EBITDA losses widening to $585 million due to ongoing execution delays, project cost pressures in offshore wind, and extended timelines for turbine commissions.
- Supply Chain and Manufacturing Bottlenecks: As total backlog expanded toward $197 billion, analysts highlighted supply-side risks where annual manufacturing capacity lags behind surging order intake, creating potential production scaling bottlenecks that could delay conversion to realized revenue and cash flow.
- Elevated Valuation and Sentiment Vulnerability: GEV trades at premium valuation multiples that demand aggressive multi-year margin expansion beyond target levels, leaving the stock highly sensitive to intraday sell-offs whenever broader market sentiment fluctuates regarding capital expenditure by major artificial intelligence infrastructure customers.
Nothing in this material constitutes investment advice, personal recommendation, investment research, an offer, or a solicitation to buy or sell any financial instrument. The content has been prepared without consideration of your individual investment objectives, financial situation, or needs, and should not be treated as such.
Past performance is not a reliable indicator of future performance and/or results. Forward-looking scenarios or forecasts are not a guarantee of future performance. Actual results may differ materially from those anticipated.
Mitrade makes no representation or warranty as to the accuracy or completeness of the information provided and accepts no liability for any loss arising from reliance on such information.
Recommended Articles


